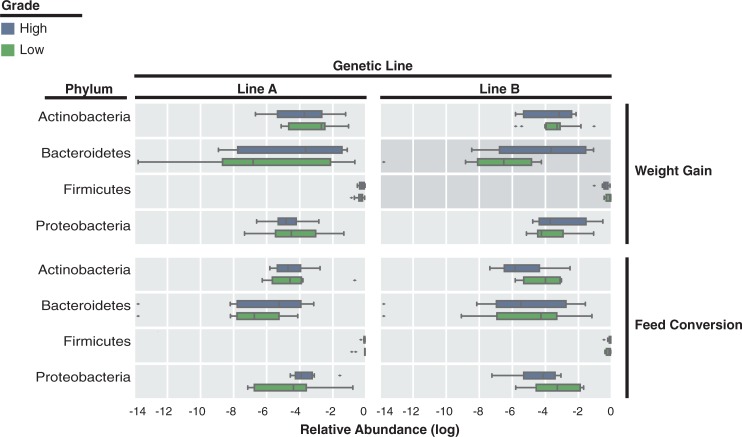
Fig 3. There are phylum level differences between genetic lines and high or low performance graded adult chickens.
We illustrate the log relative abundances of phyla observed in Line A and B chickens graded using the weight gain and feed conversion metrics. Only phyla with a non-log transformed mean abundance of at least 1% are included. Phyla that significantly differ between high and low chickens are indicated with a darker tinted background. Significance is defined as a p-value less than or equal to 0.05 using an uncorrected Mann-Whitney U-test.

