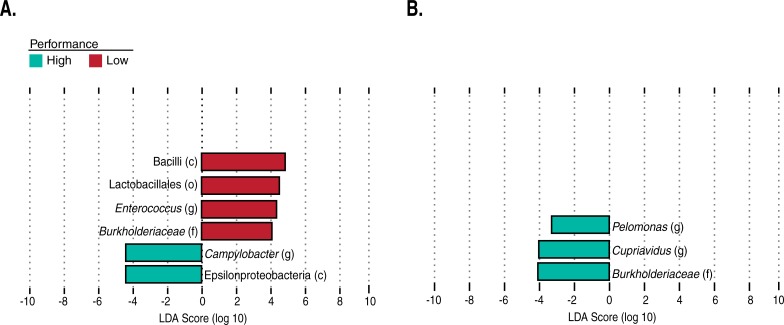
Fig 4. LDA and univariate analysis identify taxa that discriminate between high and low performing chickens.
Histograms of the LDA scores show differentially abundant features in high (blue) and low (red) (A) Line B chickens graded with weight gain; and (B) Line A chickens graded with the feed conversion metric. Only taxonomic groups representing features identified as discriminating in LDA analysis that also had a q-value less than or equal to 0.2 are included. Taxonomic levels are displayed as c, o, f, and g indicating class, order, family, and genus levels respectively.

