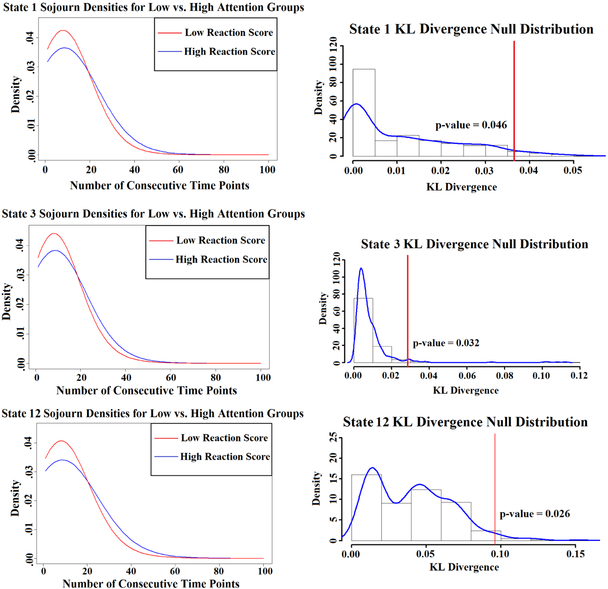
Figure 10:
(Top row) Estimated sojourn distributions of the high and low sustained attention scoring groups for three states that revealed group differences. (Bottom row) Permutation test results obtained from permuting group labels and computing KL divergence between the estimated sojourn distributions for each group. The vertical line in each plot depicts where the observed group KL divergence group fell with respect to the null distribution.

