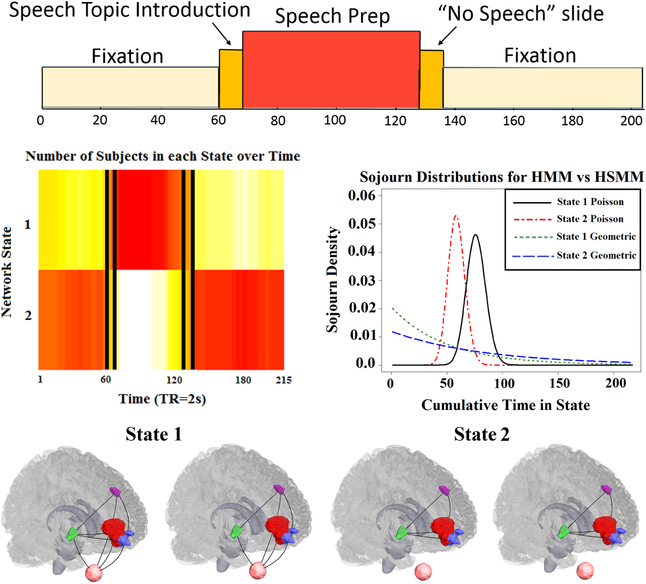
Figure 5:
(Top row) Experimental paradigm for the anxiety-inducing task [27]. (Row 2 left) Heatmap demonstrating that the HSMM closely uncovers the design of the experiment. Vertical bars indicate the true design. (Row 2 right) Sojourn distributions under both a standard HMM and a HSMM for both network states. The Poisson distributions estimated under the HSMM closely match the experimental design, while the geometric distributions, implicit in the HMM and parameterized by the diagonal of the transition matrix, do not. (Row 3) States 1 and 2 estimated via the HSMM for two different significance levels (α = 0.05 and α = 0.01, respectively for each state). Regions consist of two different subsections of the ventral medial prefrontal cortex (red and blue), the dorsal lateral prefrontal cortex (purple), and the ventral striatum (green), Heart rate (pink) is depicted below each brain image.

