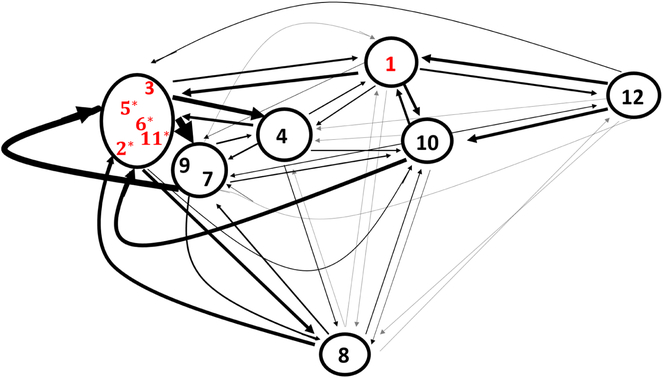
Figure 7:
Multidimensional scaling representation of the 12 network states. Relative position of one state compared to another state is determined by the Euclidean distance between covariance matrices. Edge widths are proportional to the transitional probabilities between states, with thicker edges representing a higher probability. Edges corresponding to a transition probability < 0.05 are lightened and any with a probability < 0.01 are not included. Red state labels indicate that the state was one of the top 6 states in terms of proportion of time spent in the state. Asterisks highlight states where the probability of transitioning between states within the same cluster is greater than the probability of transitioning to states outside of the cluster.

