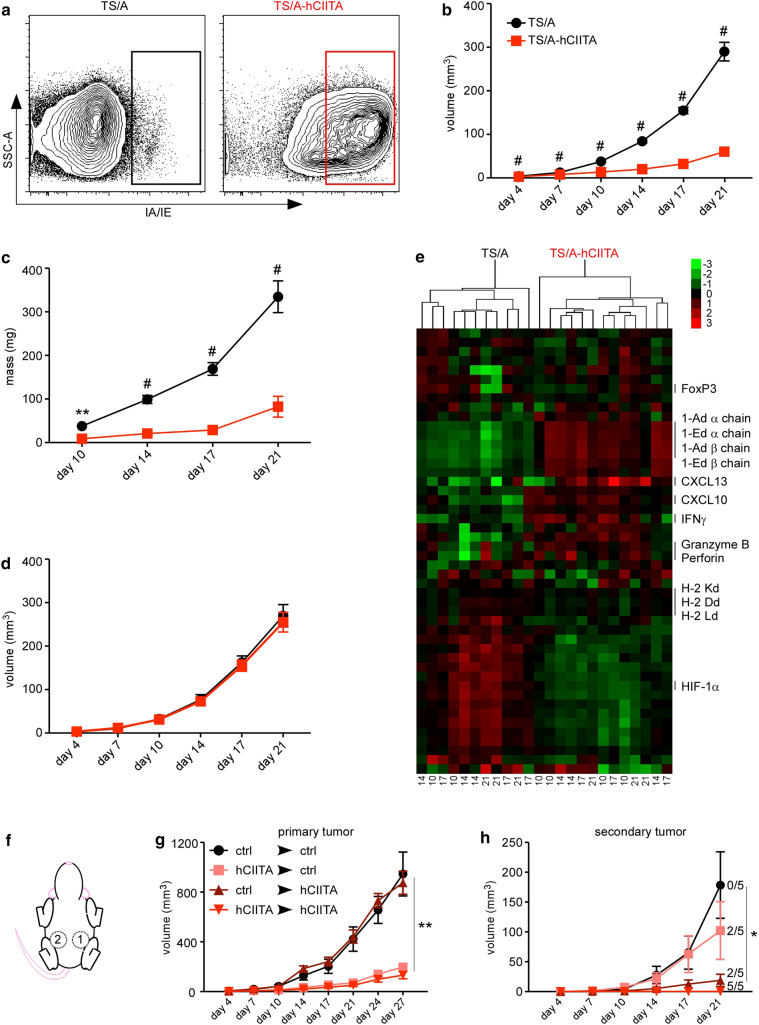
Fig. 1.
MHCII expression on tumor cells impairs tumor growth via adaptive immunity. a MHCII surface expression on live, CD45neg cells from disassociated tumors was measured by flow cytometry on day 14. b Tumor volume was monitored over time in at least 20 mice BALB/c per group per timepoint. c Tumor mass was determined in ten samples per group per timepoint. d Tumor volume was monitored over time in ten BALB/c.scid mice per group. e RNA was extracted from TS/A and TS/A-CIITA tumors (harvest day listed across bottom) and analyzed by Nanostring assay. Heat map shows fold increases in red and fold decreases in green. f Schematic of sequential tumor injections into contralateral mammary pads of the same mouse. g Growth of primary tumors. h Growth of secondary tumors. Error bars represent standard error of the mean. Statistical differences are expressed as *p < 0.05, **p < 0.005, #p < 0.0005

