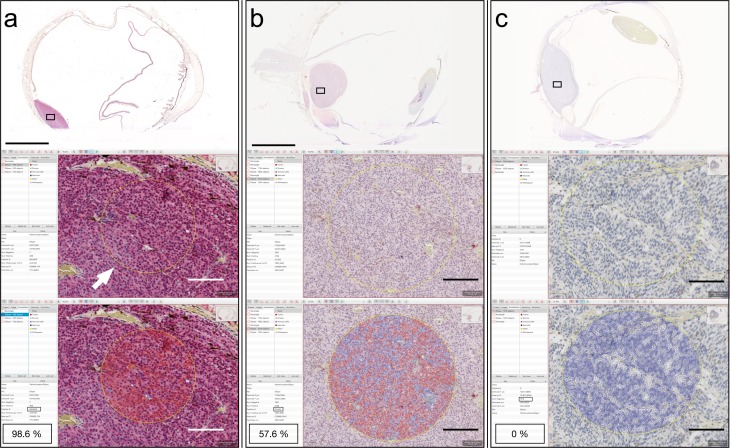
Figure 1.
Example of digital image analysis in three tumors with different levels of BAP-1 expression. (a) In a tumor with intensive stain on overview, a circular region of interest has been defined in ×20 (arrow). In this circular area, the software then automatically evaluates the number of cells with nuclear stain (cell borders and nuclei marked red by the software). As indicated in the annotation window 98.6% of the cells were classified as positive. (b) In a tumor with intermediate stain on overview, both cells with (cell borders and nuclei marked red by the software) and without detected stain (cell borders and nuclei marked blue by the software) are present. As indicated in the annotation window, 57.6% of the cells were classified as positive. (c) In a tumor with no stain on overview, only cells without detected stain (cell borders and nuclei marked blue by the software) are found. As indicated in the annotation window, 0% of the cells were classified as positive. Scale bars: top = 5 mm, lower = 100 μm.

