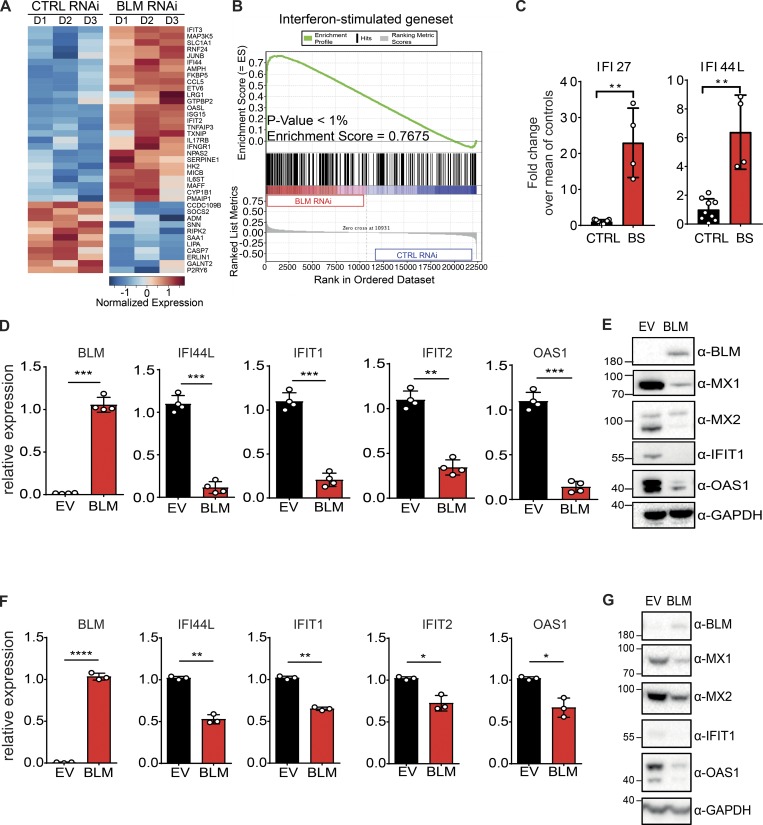
Figure 1.
BS cells exhibit an ISG signature. (A) Heatmap representing the Z-score for normalized expression values of 38 ISGs between control (CTRL RNAi) and BLM-depleted (BLM RNAi) HeLa cells. ISGs were selected from another study (Schoggins et al., 2011). (B) Gene set enrichment analysis of ISGs in control (CTRL RNAi) and BLM-depleted (BLM RNAi) HeLa cells (see Materials and methods). (C) mRNA level expression of IFI44L and IFI27 determined by RT-qPCR in primary CTRL and BS fibroblasts. Data are the combination of three independent experiments (nCTRL = 2, 3, and 4, and nBS = 1, 2, and 1, respectively, for each experiment). Values were normalized to the average of controls within each experiment (mean with SD; Mann-Whitney, **P < 0.01). (D) mRNA level expression of BLM, IFI44L, IFIT1, IFIT2, and OAS1 determined by RT-qPCR in SV40-immortalized BS cells transduced with BLM or EV (mean with SD of n = 4 independent experiments; paired t test, **P < 0.01, ***P < 0.001). (E) Protein levels of BLM, MX1, MX2, IFIT1, OAS1, and GAPDH in cells, as in D (representative of n = 4 independent experiments). (F) Expression of BLM, IFI44L, IFIT1, IFIT2, and OAS1 in primary BS cells transduced with BLM or EV (mean with SD of n = 3 independent experiments; paired t test, *P < 0.05, **P < 0.01, ****P < 0.0001). (G) Protein levels of BLM, MX2, MX1, IFIT1, OAS1, and GAPDH in cells, as in F (representative of n = 3 independent experiments).

