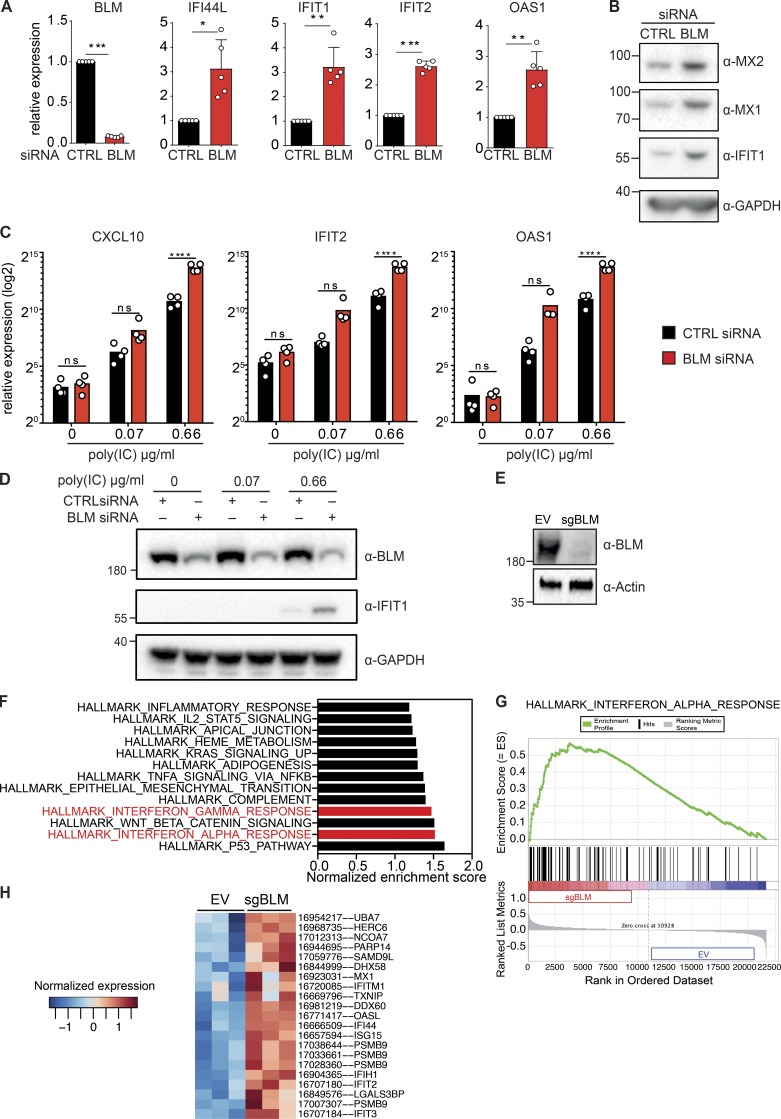
Figure 2.
Down-regulation of BLM induces ISGs. (A) mRNA level expression of BLM, IFI44L, IFIT1, IFIT2, and OAS1 determined by RT-qPCR in primary human fibroblasts treated with control (CTRL) or BLM siRNA for 72 h (mean with SD of n = 5 independent experiments; one-sample t test, *P < 0.05, **P < 0.01, ***P < 0.001). (B) Protein levels of MX2, MX1, IFIT1, and GAPDH in primary human fibroblasts treated with control or BLM siRNA for 72 h (representative of n = 5 independent experiments). (C) mRNA level expression of CXCL10, IFIT2, and OAS1 determined by RT-qPCR in primary human fibroblasts treated with control or BLM siRNA for 48 h followed by 24 h of treatment with poly(I:C) (mean with SD of n = 4 independent experiments; one-way ANOVA with Tukey post-test, ****P < 0.0001). (D) Protein levels of BLM, IFIT1, and GAPDH in primary human fibroblasts treated with control or BLM siRNA for 48 h followed by 24 h of treatment with poly(I:C) (representative of n = 4 independent experiments). (E) Protein levels of BLM and Actin in SV40-immortalized cells after transduction with CRISPR-Cas9 lentivector targeting BLM (sgBLM) and the corresponding control lentivectors (EV; representative of three independent replicates). (F) Normalized enrichment score of the hallmark gene sets that were significantly enriched in BLM knockout cells over control cells, as in E. Microarray-based analysis of three independent replicates. (G) Enrichment of the hallmark IFNα response gene set in BLM knockout cells. (H) Heatmap representing the Z-score for normalized expression values of the hallmark IFNα response genes that were significantly deregulated at the gene level between BLM knockout cells and control cells (P < 0.05).

