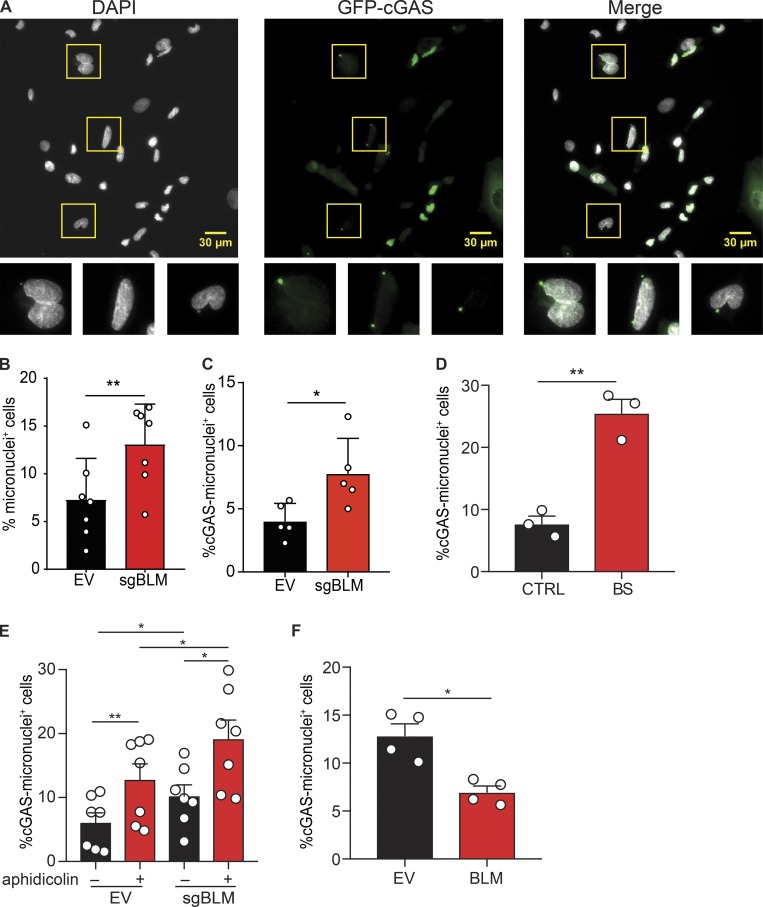
Figure 5.
BLM deficiency increases the frequency of micronuclei positive for cGAS. (A) Identification of total and cGAS-positive micronuclei in SV40-immortalized BLM-knockout cells, as in Fig. 4 A. Cells were transduced with GFP-cGAS E225A-D227A lentivector to visualize cGAS-positive micronuclei. Scale bars, 30 μm. (B) Frequency of cells positive for at least one micronucleus in SV40-immortalized control (EV) or BLM-deficient cells (sgBLM), as in Fig. 4 A (mean with SD of n = 7 combined independent experiments; paired t test, **P < 0.01). (C) Frequency of cells positive for at least for one GFP-cGAS–positive micronucleus in SV40-immortalized control (EV) or BLM-knockout cells (sgBLM), as in Fig. 4 A (mean with SD of n = 5 combined independent experiments; paired t test, *P < 0.05). (D) Frequency of cells positive for at least one GFP-cGAS–positive micronucleus in primary control (CTRL) or BLM-deficient fibroblasts (BS; mean with SEM of n = 3 combined independent experiments; paired t test, **P < 0.01). (E) Frequency of cells positive for at least one GFP-cGAS–positive micronucleus in SV40-immortalized control (EV) or BLM-knockout cells (sgBLM) and treated by aphidicolin (mean with SEM of n = 7 combined independent experiment; treatment with 12 or 30 µM in four and three experiments, respectively; repeated measures one-way ANOVA with a Tukey post-test, *P < 0.05, **P < 0.01). (F) Frequency of cells positive for at least one GFP-cGAS–positive micronucleus in SV40-immortalized control BS cells or BLM-transduced BS cells, as in Fig. 1 D (mean with SEM of n = 4 combined independent experiments; paired t test, *P < 0.05).

