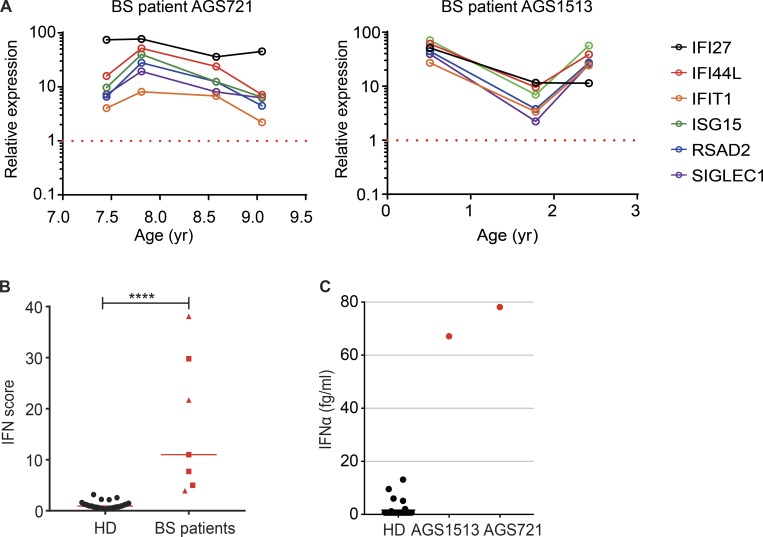
Figure 6.
Increased ISG expression in BS patients. (A) IFI27, IFI44L, IFIT1, ISG15, RSAD2, and SIGLEC1 expression was measured in the whole blood of two BS patients (AGS721 and AGS1513). Measurements were made at different time points and were normalized to 29 control samples (set to 1; red dotted line). (B) IFN score of the two BS patients (red squares: AGS721; red triangles: AGS1513) and control individuals (bar = median; Mann-Whitney test, ****P < 0.0001). (C) IFNα protein concentration in 36 control sera, in serum from the AGS1513 BS patient, and in CSF from the AGS712 BS patient.

