Figure 1.
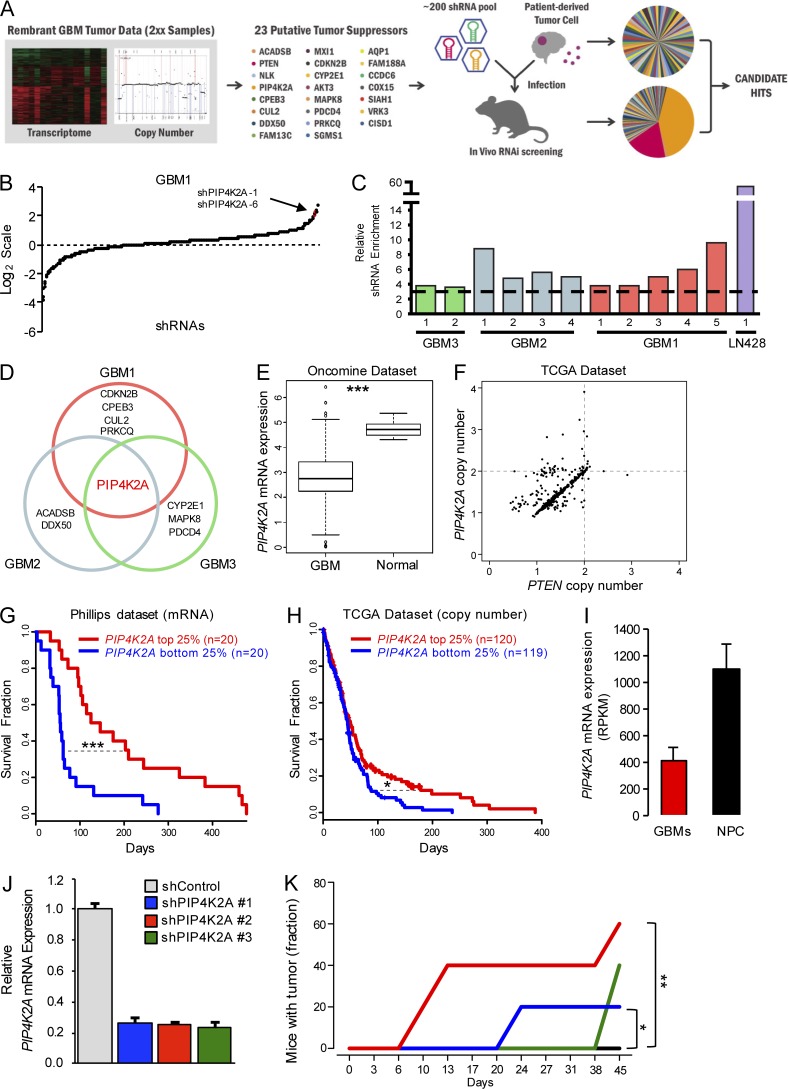
In vivo RNAi screen identifies putative tumor suppressors in GBM. (A) A schematic representation of in vivo RNAi screen. Candidate tumor suppressor genes were selected based on the genomic and transcriptome data from the Rembrandt database, and their target shRNA library pool was generated and transduced into patient-derived GBM cells and injected into the recipient mice brains. Harvested shRNAs were PCR amplified and deep sequenced to identify candidate “hits.” (B) Enrichment or depletion (log2 scale) of a pool of shRNAs from post–in vivo RNAi screen in GBM1. The representation of each shRNA was normalized to the initial control population. (C) Enrichment of PIP4K2A-targeting shRNAs from the in vivo RNAi screen. Each bar represents an individual xenograft tumor from the corresponding GBM cells. The dashed black line represents threefold enrichment compared to the control population. (D) Candidate hits that were enriched from the in vivo RNAi screen. (E) Oncomine microarray data analysis for PIP4K2A expression in GBM versus normal brain tissues (P = 2.129−09). (F) TCGA data analysis for PIP4K2A and PTEN copy number in GBM. (G) Kaplan–Meier survival curve of GBM patients based on PIP4K2A mRNA expression level (P = 2.95−04). (H) Kaplan–Meier survival curve of GBM patients based on PIP4K2A CNAs (P = 0.045). (I) PIP4K2A mRNA expression levels between sets of GBM cells and normal NPCs. RPKM stands for reads per kilobase of transcript per million reads, which derived from RNA sequencing reads. (J) Real-time RT-PCR analysis to determine the effects of individual shPIP4K2As on PIP4K2A mRNA expression level in LN-428. (K) Subcutaneous tumor engraftment of LN-428 cells that were infected with the corresponding indicated viruses (n = 5 mice per group). P values: E, two-sided Wilcoxon rank-sum test; G, H, and K, two-sided log-rank test. *, P ≤ 0.05; **, P ≤ 0.01; ***, P ≤ 0.001. Values are presented as mean ± SD.

