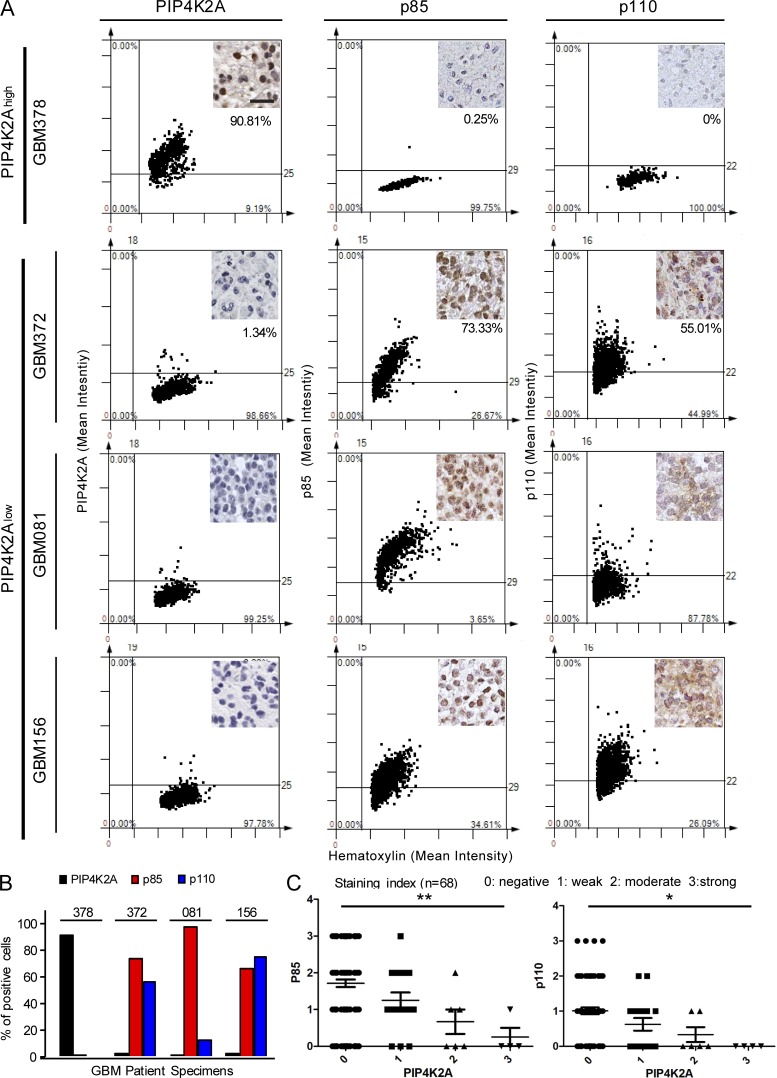
Figure 5.
Interrelation between PIP4K2A and PI3K subunits in human GBM specimens. (A) Representative immunohistochemical images and TMA of PIP4K2A, p85, and p110 on 88 GBM brain specimens. Quantitative assessment of PIP4K2A, p85, and p110 immunohistochemical signals in GBM tissues was measured on intensity over area. Intensity was measured in different areas of the tissue that were selected randomly (±SD, n = 4). Bar, 50 µm. (B) Bar graph representation of PIP4K2A, p85, and p110 positive cells. (C) Bar graph representation of PIP4K2A expression with p85 (left) or p110 (right) expression intensity on randomly selected tumor regions. P values: C, one-way ANOVA test.

