Figure 2.
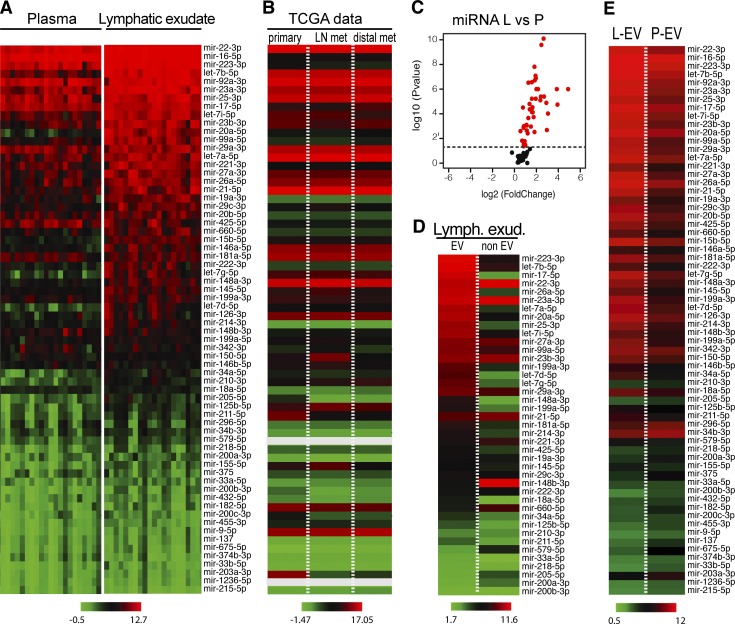
Lymphatic exudate is dramatically enriched compared with plasma in melanoma-relevant miRNAs, which mostly associate with EVs. (A) Heat map of melanoma-associated miRNAs contained in plasma and lymphatic exudate of metastatic melanoma patients (n = 12, data sorted by average expression levels in lymph). (B) TCGA data showing average expression levels of the same miRNAs, in the same order, in primary melanoma (n = 104) and at metastatic sites (regional LN metastasis, n = 226; distal metastasis, n = 67). Gray bars reflect miRNAs that were not reported. (C) Volcano plot of miRNA expression in lymphatic exudate (L) relative to that in plasma (P; each miRNA averaged across all patients, with red indicating the miRNAs with P < 0.05). (D) Within the lymphatic exudate (Lymph. exud.), content of lymph-enriched melanoma–associated miRNAs in EV and non-EV fractions of metastatic melanoma patients. (E) Comparative average miRNA expression in the EV fraction from lymphatic exudate (L-EV) or plasma (P-EV; n = 11, data sorted by average expression of miRNAs in EV fraction, raw data in Table S1).

