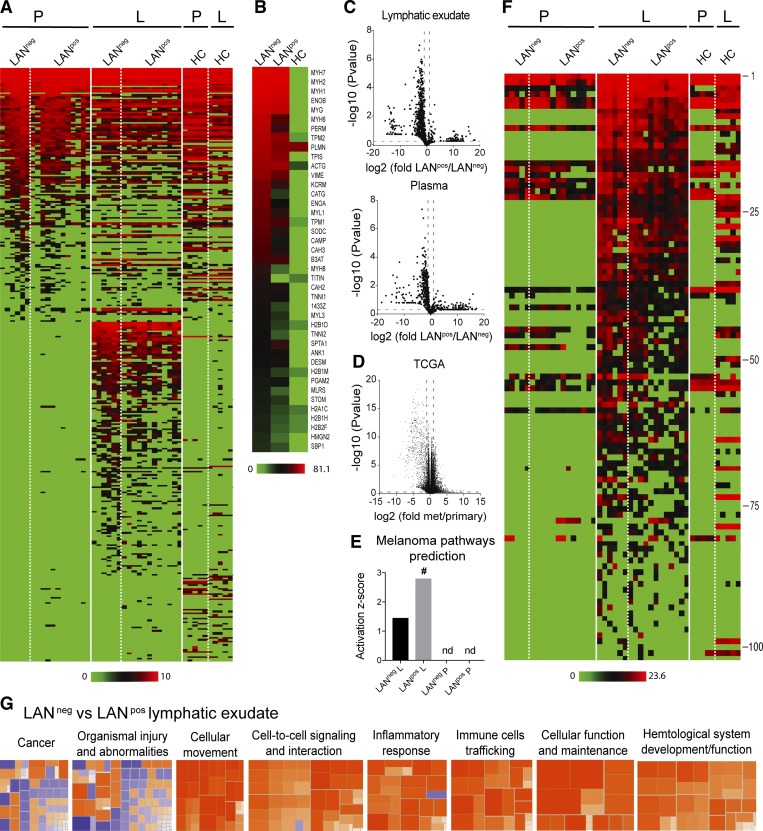
Figure 3.
Lymphatic exudate contains distinct protein signatures from plasma that better predict cancer pathways and that correlate with degree of metastatic spread. Patients were grouped as LAN negative or positive, according to the absence (LANneg) or presence (LANpos) of metastases in one or more of the resected LNs; HCs are shown for comparison. (A) Unbiased heat map highlighting global proteomic profiling of lymphatic exudate (L) and plasma (P) from LANneg and LANpos patients; data sorted by average expression of proteins in plasma and then lymphatic exudate. (B) Averaged expression profiles of the 40 most abundant proteins in the lymphatic exudate from each group (ranked by averaged expression in both LANneg and LANpos patients). (C) Volcano plot depictions of global proteomics profiling comparison of lymphatic exudate (top) and plasma (bottom) from LANneg and LANpos patients. (D) Volcano plot depiction of TCGA mRNA profiling of metastatic versus primary melanoma tumors. Dotted lines indicate limits where P value < 0.05 and ± twofold changes. (E) Activation scores of the melanoma-specific pathway prediction in lymphatic exudate versus plasma of patients; # indicates significant increase (P < 0.05); nd, not determined. (F) Heat map of 102 melanoma-associated proteins (described in the publicly available “Human Protein Atlas”) analyzed by LFQ proteomics and sorted from highest to lowest levels in lymphatic exudate (protein names and raw data are found in Table S1). (G) Activation z-scores of pathways that are up-regulated (>2, orange) or down-regulated (< −2, blue) in lymphatic exudate of LANneg versus LANpos patients. All data represent n = 6 for LANneg, n = 12 for LANpos, and n = 5 for HC. Raw data in Table S1.

