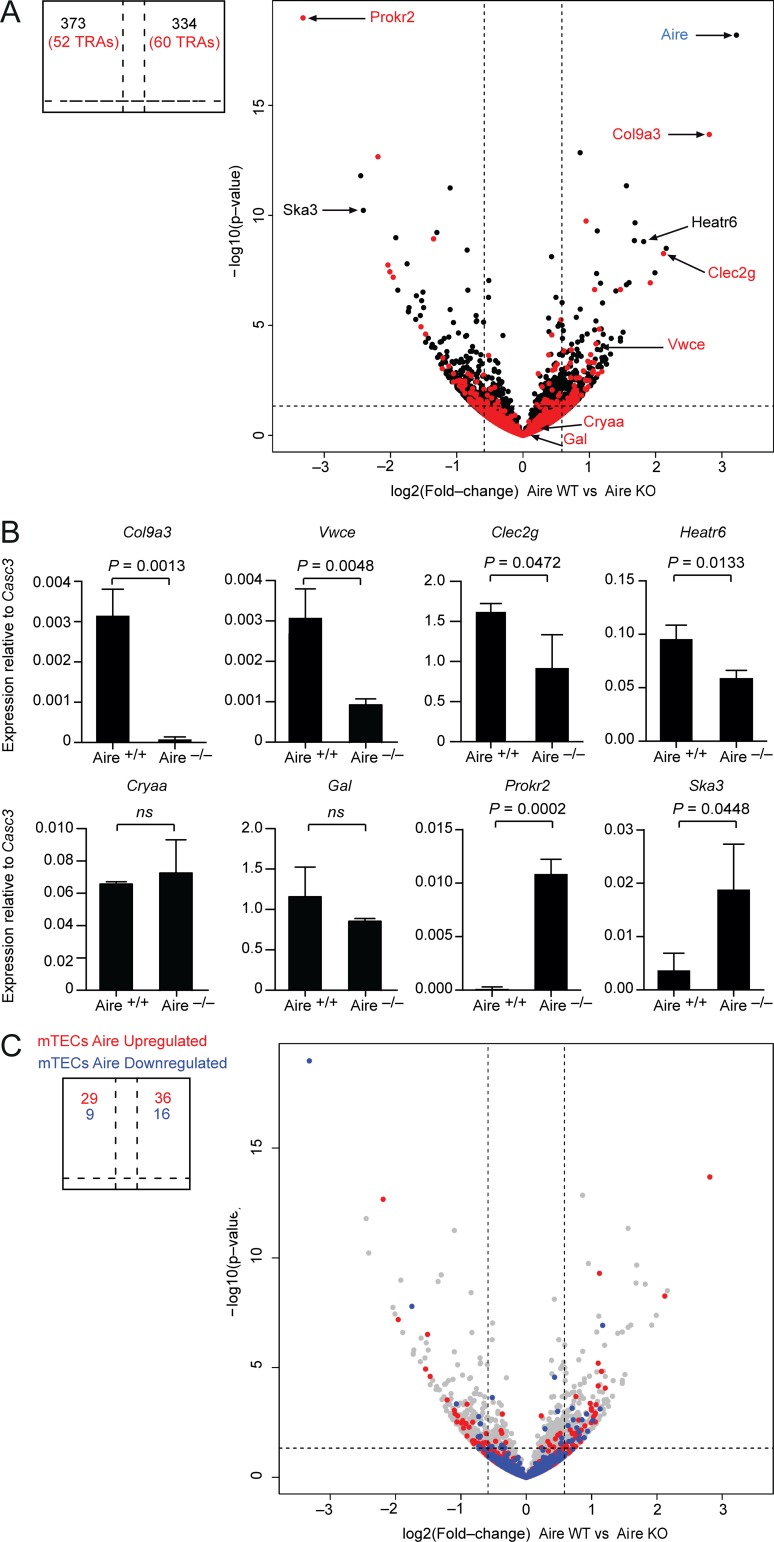
Figure 4.
Aire orchestrates a distinct genetic program in Aire+ ILC3-like cells. (A) RNA-seq data from Lin–MHCIIhiCD80+ cells from Aire+/+ and Aire−/− mice. Genes encoding for TRAs are colored in red. Fold-change cutoff: 1.5; P value: 0.05 (indicated by a dashed line). (B) Quantitative PCR analysis of mRNA expression of selected differentially expressed genes. Data are mean ± SD of three independent experiments. ns, not significant. (C) Comparison of Aire-dependent gene expression in Aire+ LN cells and mTECs. Genes that are up-regulated (depicted in red; 1,732 genes) or down-regulated (depicted in blue; 423 genes) by Aire in mTECs by at least 1.5-fold were projected onto the volcano plot shown in A. Student’s t test was used to calculate P values.

