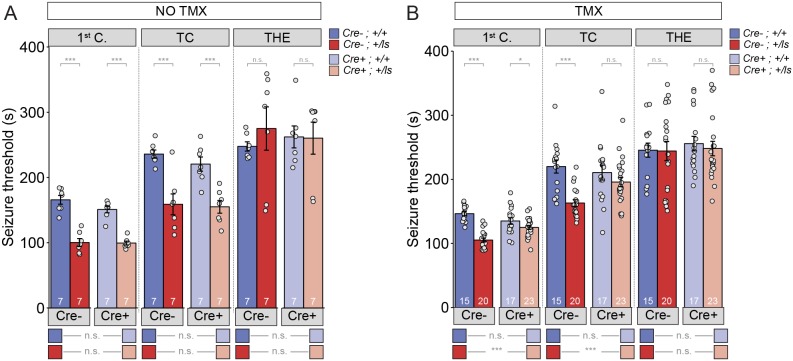
Figure 1. Seizure threshold is improved after adult restoration of SynGAP expression.
(A) SyngapCre-;+/ls and SyngapCre+;+/ls mice exhibit hyperexcitability in two of the three events without Cre activation (No TMX) Main effects-1st clonus: Cre F(1,24)=2.13, p=0.157, Genotype F = 117.73, p=9.75E-11, Interaction F(1,24)=1.69, p=0.206); Cre- Cohen’s d = 3.855, Cre +Cohen’s d = 4.737. TC: Cre F(1,24)=722, p=0.404, Genotype F(1,24)=40.05, p=1.53E-6), Interaction F(1,24)=.257, p=0.617); Cre- Cohen’s d = 2.396, Cre+ Cohen’s d = 2.405. THE: Cre F(1,24)=9.99E-6, p=0.998, Genotype F(1,24)=.320, p=0.577), Interaction F(1,24)=.420, p=0.523. (B) SyngapCre+;+/ls mice exhibit thresholds comparable to those of SyngapCre-;+/ls mice after Cre activation (TMX-treated) in two of the three events Main effects-1st clonus: Cre F(1,71)=2.59, p=0.112; Genotype F(1,71)=58.328, p=7.86E-11, Interaction F = 1 (1,71)=18.84 p=4.62E-5; Cre- Cohen’s d = 3.329, Cre+ Cohen’s d = 0.674; TC: Cre F(1,71)=4.53, p=0.037, Genotype F(1,71)=26.15, p=2.57E-6, Interaction F(1,71)=6.50, p=0.013; Cre- Cohen’s d = 2.040; Cre+ Cohen's d = 0.540; THE: Cre F(1,71)=.037, p=0.847, Genotype F(1,71)=1.15E-5, p=0.997, Interaction F(1,71)=.049, p=0.826. Data points (and numbers) in bars represent biological replicates (animals). Data from panel B are pooled from two separate experiments.
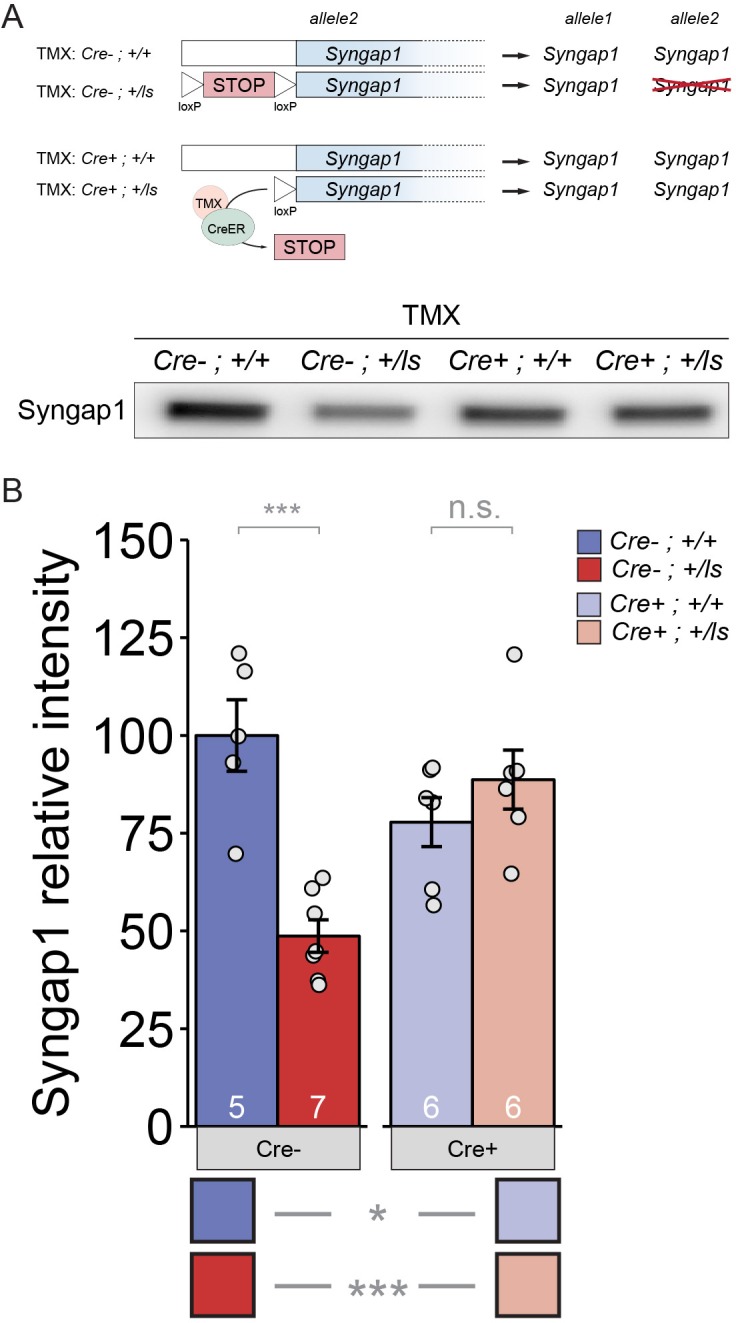
Figure 1—figure supplement 1. TMX-induced restoration of SynGAP protein levels in adult Syngap1Cre+;+/ls mice.


