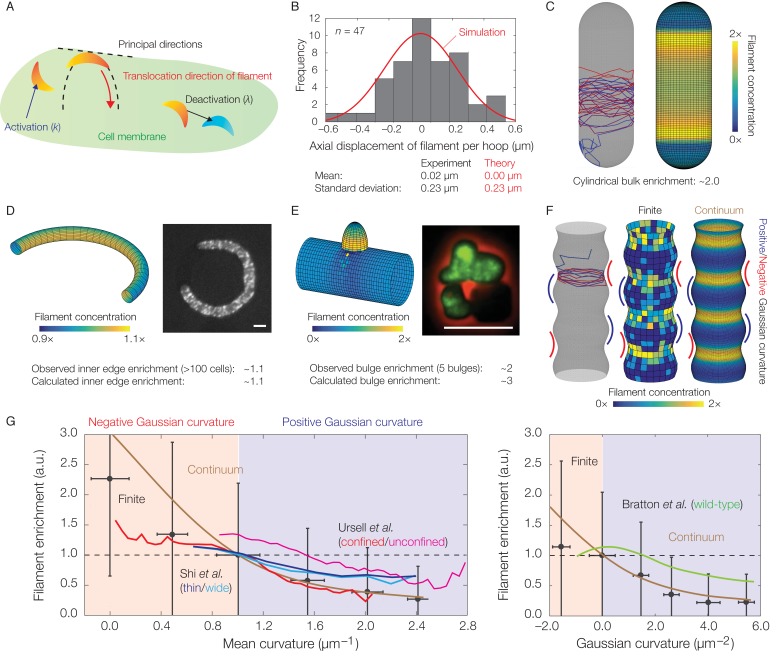
Figure 3. Dynamics of translocation and implications to MreB localization.
In this figure, the localization of MreB filaments, which exhibit a finite processivity and are assumed to follow the parameter values summarized in Supplementary file 2, is shown. (A) A schematic of the model of filament translocation. The filament is modeled as a point which moves processively in a direction determined by the principal curvatures. (B) Histogram of the axial displacements per hoop translocated of 47 MreB filaments in B. subtilis cells (Hussain et al., 2018), along with the theoretical prediction and a simulation result shown. (C) Langevin simulation (left) of Equation (3) and numerical result (right) for the filament concentration, , on a spherocylinder, for parameter values relevant to E. coli. Here and below, blue and red denote starts and ends of trajectories, respectively, details of simulations and numerics are provided in Appendix 1, and is found by solving the Fokker-Planck equation corresponding to Equation (3). (D) (Left) Numerical result for on a bent rod, for parameter values relevant to E. coli. (Right) Representative fluorescence microscopy image of an E. coli cell confined to a donut-shaped microchamber, with MreB tagged by green fluorescent protein (GFP), from Wong et al. (2017). The inner edge enrichment is calculated as described in Wong et al. (2017), and the scale bar indicates 1 μm. (E) (Left) Numerical result for on a cylinder with a bulge, for parameter values relevant to B. subtilis. (Right) Representative fluorescence microscopy image of a deformed B. subtilis cell with a bulge and GFP-tagged MreB, from Hussain et al. (2018). The bulge enrichment is calculated as a ratio of average pixel intensities, and the scale bar indicates 5 μm. (F) Langevin simulation and numerical results for on a cylinder with surface undulations in both the finite (Langevin, total of ~500 filaments) and continuum (Fokker-Planck) cases, for parameter values relevant to E. coli. (G) A plot of (left) the mean curvature and (right) the Gaussian curvature against filament enrichment for the figures shown in (F) (Langevin simulation, black; continuum case, brown), with empirically observed relations from confined and unconfined MreB-labeled E. coli cells (red and magenta) from Ursell et al. (2014), thin and wide mutant E. coli cells (blue and cyan) from Shi et al. (2017), and wild-type E. coli cells (green) from Bratton et al. (2018) overlaid. Error bars denote one standard deviation in the Langevin simulation, and 1 a.u. equals the mean of when the mean curvature is 1 µm−1 (left) and when the Gaussian curvature is 0 µm−2 (right). Note that the magenta and green curves are not normalized according to this convention.


