. 2019 Feb 18;8:e40472. doi: 10.7554/eLife.40472

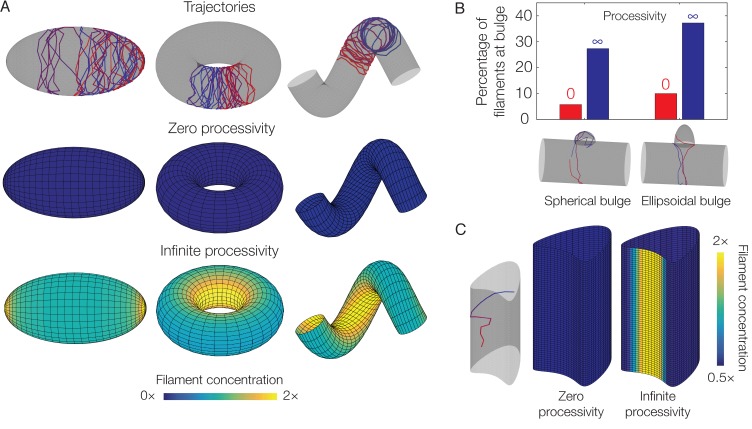
Figure 4. Dependence of localization on processivity and Gaussian curvature.

(A) Langevin simulations of Equation (3) and numerical results for CF, the filament concentration, on different surfaces. Note that cases of zero processivity correspond to uniform distributions and that we have considered the limiting cases of zero and infinite processivity, along with a constant value of the translocation noise (σ), here. Figure 3 shows numerical results for the case of a large, but finite, processivity and a principal curvature-dependent translocation noise relevant to MreB. (B) Plot of the percentage of total filaments contained in a bulge, for the two different geometries indicated in the limits of zero and infinite processivity. (C) Langevin simulation and numerical result for CF on a non-circular cylinder in the limits of zero and infinite processivity.

Figure 4.

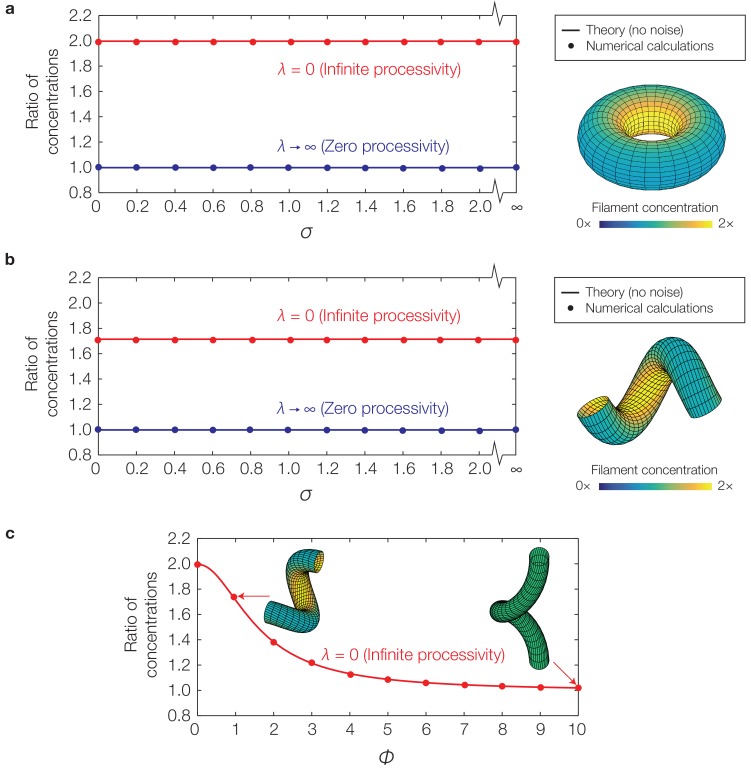
Figure 4—figure supplement 1. Curvature-based translocation on a torus and a helix.

Figure 4—figure supplement 1.

(a) Plot of the ratio of π2πCF𝑑u to 0πCF𝑑u for a torus, corresponding to the ratio of filament concentrations between the inner and outer edges, against the translocation noise (σ), as determined by numerical calculations. The theoretical predictions assuming no noise are shown as lines. (Inset) Representative result for CF in the case of infinite processivity and σ=0.3, as shown with its zero processivity counterpart in Figure 4A of the main text. (b) Same as (a), but for a helix. (c) Same as (b), but against varying helical pitches (ϕ) and for a fixed value of σ=0.
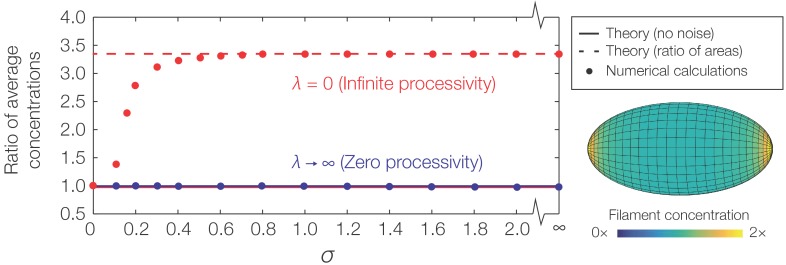
Figure 4—figure supplement 2. Curvature-based translocation on an ellipsoid.

Figure 4—figure supplement 2.

Plot of the ratio of CFS to CFS, where S={X:u<π/4 or u>3π/4} denotes the caps and S={X:π/4u3π/4} denotes the region away from the caps, against σ as determined by numerical calculations. The theoretical predictions assuming no noise are shown as lines. (Inset) Representative result for CF in the case of infinite processivity and σ=0.3, as shown with its zero processivity counterpart in Figure 4A of the main text.
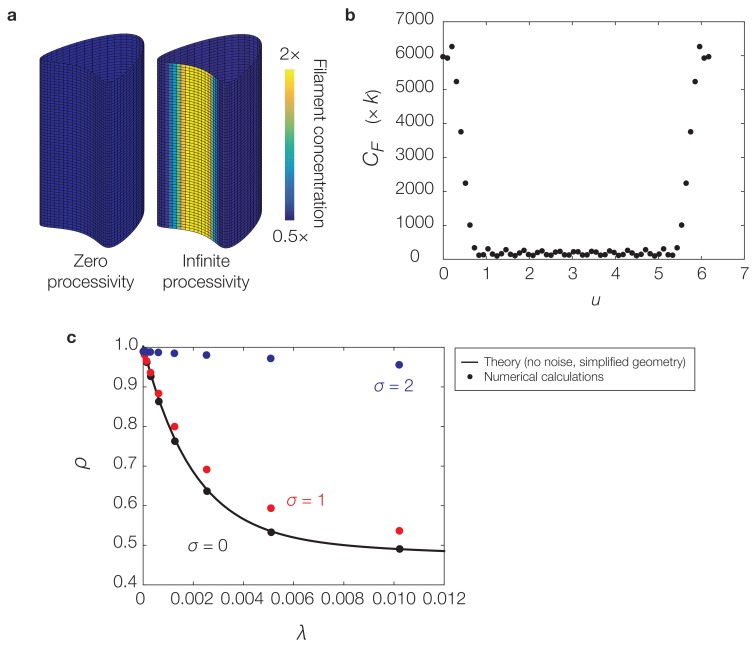
Figure 4—figure supplement 3. Curvature-based translocation on a geometry with zero Gaussian curvature.

Figure 4—figure supplement 3.

(a) Same as Figure 4C of the main text. (b) Plot of the u-coordinate against filament concentration, CF, (with units of k) for the case of infinite processivity in (a). (c) Plot of the deactivation rate, λ, against the localization ratio, ρ, for similar calculations and parameters as in (a) but varying σ and λ. Similar to Equation (S31) of Appendix 1, ρ is determined for the geometry considered here as the quotient maxu(NF(u),λ)/maxu(NF(u),λ/2). The theoretical prediction for ρ is determined in a simple case by Equation (S30) and (S31) of Appendix 1. For the theoretical prediction based on section 2.6 of Appendix 1, we set ν=0.4 and t=103 in non-dimensional units in the equations above to correspond to the values of L and N used in numerics.
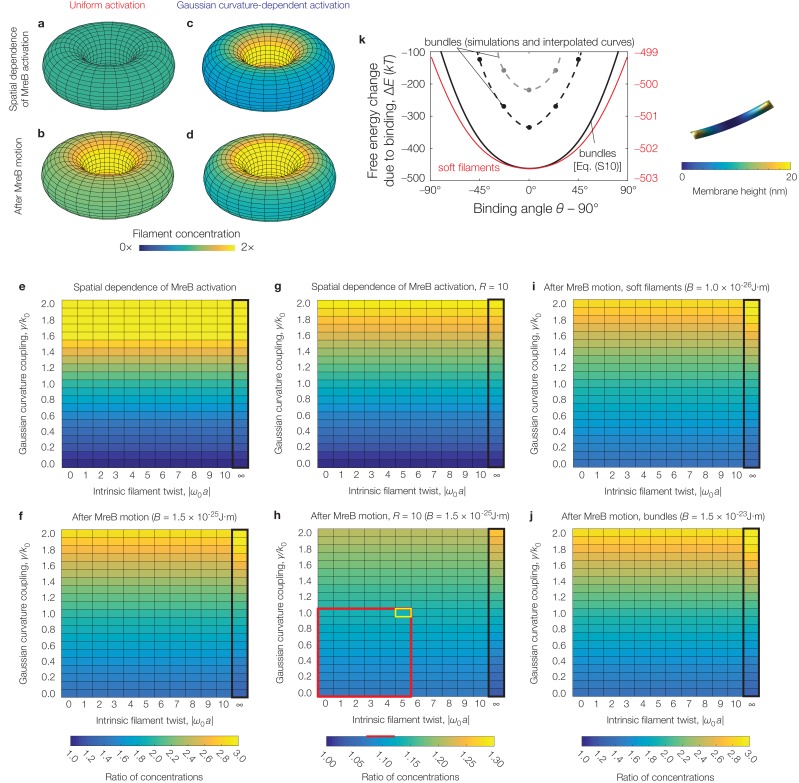
Figure 4—figure supplement 4. Effects of filament twist, flexural rigidity, and Gaussian curvature-dependent activation on model predictions.

Figure 4—figure supplement 4.

(a-d) Numerical results for the filament concentration (CF) on a torus, for the parameter values relevant to E. coli as summarized in Supplementary file 2 and the absence (a, b) or presence (c, d) of Gaussian curvature-dependent activation, with γ/k0=2 (see also Figure 4—figure supplement 1). (e-j) Numerical results for the ratio of filament concentrations (see Figure 4—figure supplement 1) for a torus across different values of intrinsic filament twist, Gaussian curvature coupling, and flexural rigidity (B). Panels (e), (f), (i), and (j), which all share the same color map, assume R=2 while panels (g) and (h), which share the same color map, assume R=10, as to be comparable to curvatures observed in prior experiments (Wong et al., 2017). The black box indicates parameter values where filament binding becomes energetically unfavorable. The red box highlights the characteristic range of parameter values consistent with prior experiments (Wong et al., 2017) and estimates (Quint et al., 2016), while the corresponding red line highlights the calculated range of concentration ratios. The cell outlined in yellow indicates values simulated in Figure 3—figure supplement 3b. We find that the concentration ratios are largely robust to twist, but vary only for large values of Gaussian curvature coupling. (k) Similar to Figure 2B of the main text, but for numerical solutions of Equation (S6) of Appendix 1 for parameters relevant to E. coli—namely, a pressure of p=1 atm—and an MreB bundle with flexural rigidity B=1.5×10²³ Jm, cross-sectional radius rf=10 nm, and no twist over a domain size of 30 nm×240 nm (black points) and 40 nm×300 nm (gray points). One such solution, corresponding to a binding angle of θ-90=0 for the smaller domain, is shown to the right. The numerical results are similar to the estimate of Equation (S10) of Appendix 1 (black curve). The red curve and scale show the prediction of Equation (S10) of Appendix 1 for a MreB filament with B=1.0×1026 Jm and no twist.