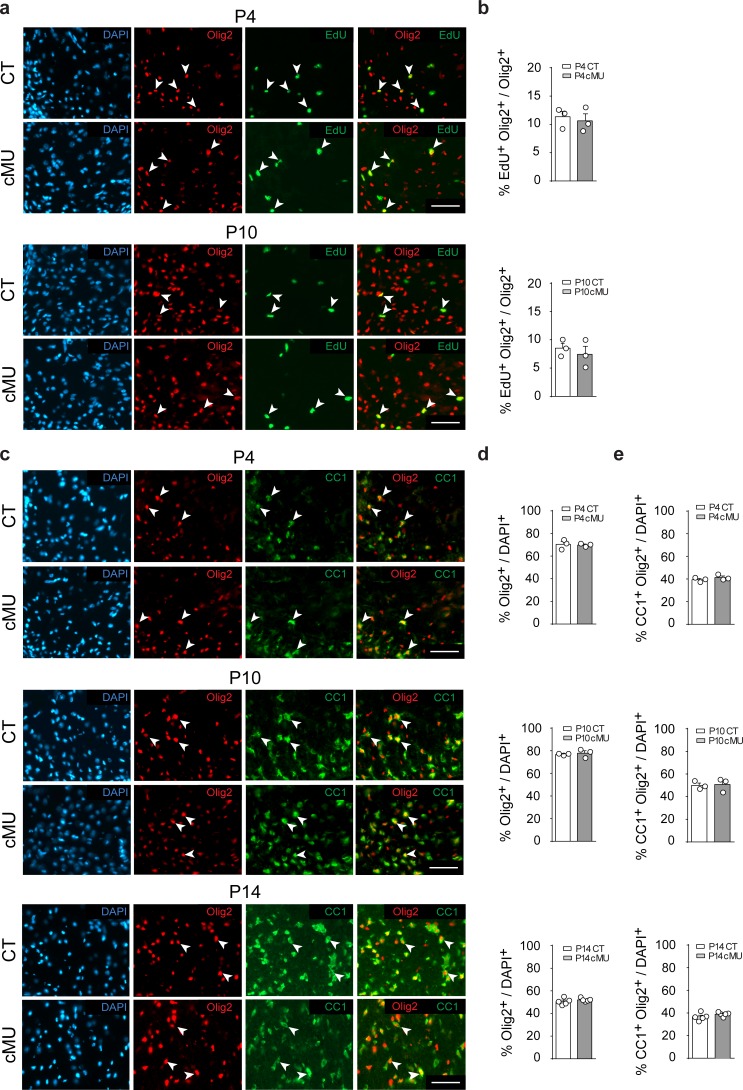
Figure 2. De novo fatty acid synthesis is not required to achieve correct numbers of oligodendrocyte lineage cells during development.
(a) Representative immunostaining of ventral white matter in cross-sectioned spinal cords of P4 and P10 mice identifying proliferating (EdU+) OLs (Olig2+; examples indicated by arrowheads), n = 3 mice for each, CT and cMU. Nuclear marker: DAPI. Scale bar: 50 μm, applying to entire panel. (b) Corresponding graphs to (a) with quantification of percentage of proliferating OLs (EdU+ Olig2+) over total number of OLs (Olig2+) in spinal cord white matter of CT and cMU mice at P4 and P10. Data points represent n = 3 mice for each, CT and cMU; random fields of both dorsal and ventral white matter of 4 sections quantified per animal, with at least 83 Olig2+ cells quantified per section (unpaired two-tailed two sample Student’s t-test; at P4: cMU vs. CT, p=0.6876, t = 0.4326; P10: cMU vs. CT, p=0.5448, t = 0.6608). (c) Representative immunostaining of ventral white matter in cross-sectioned spinal cords from P4, P10, and P14 mice identifying differentiated OLs (CC1+; examples indicated by arrowheads), OLs (Olig2+) and total number of cells (DAPI+), n = 3 mice for each, CT and cMU at P4 and P10, n = 5 mice for each, CT and cMU at P14. Nuclear marker: DAPI. Scale bar: 50 μm, applying to entire panel. (d, e) Corresponding graphs to (c) with quantification of percentage of total OLs (Olig2+) (d) and differentiated OLs (CC1+ Olig2+) (e) over total number of cells (DAPI+), in the spinal cord white matter of CT and cMU mice at P4, P10 and P14. Data points represent n = 3 mice for each, CT and cMU at P4 and P10, and n = 5 mice for each, CT and cMU at P14. Random fields of both dorsal and ventral white matter of at least 3 sections quantified per animal, with at least 83 Olig2+ cells quantified per section (unpaired two-tailed two sample Student’s t-test; % Olig2+/DAPI+ at P4: cMU vs. CT, p=0.8280, t = 0.2319; at P10: cMU vs. CT, p=0.6694, t = 0.46; at P14: cMU vs. CT, p=0.3340, t = 1.028; % CC1+ Olig2+ / DAPI+ at P4: cMU vs. CT, p=0.3405, t = 1.081; at P10: cMU vs. CT, p=0.8490, t = 0.2031; at P14: cMU vs. CT, p=0.2061, t = 1.376). Bars represent mean ±SEM. CT = control, cMU = conditional mutant.


