. 2019 May 7;8:e44702. doi: 10.7554/eLife.44702

Figure 3. De novo fatty acid synthesis by oligodendrocytes is essential to achieve accurate myelination in the spinal cord.

(a) Representative EM images of P14 control (CT, a’ and a’’) and conditional mutant (cMU, b’ and b’’) white matter from the ventral funiculi of lumbar spinal cords. cMUs show more naked axons, not-yet enwrapped by myelin, when compared to CTs. cMUs also display thinner myelin (examples indicated by arrows). Scale bars: 2 μm. (b) Corresponding graph with quantification of percentage of not myelinated axons at P14. Data points represent n = 3 mice for each, CT and cMU, with at least 590 axons quantified per animal in random fields selected in the same anatomical area (unpaired two-tailed two sample Student’s t-test; at P14: cMU vs. CT, p=0.0225, t = 3.614), *p<0.05. (c) Overall hypomyelination at P14 in cMU as shown by g-ratio analysis. Data points represent n = 3 mice for each, CT and cMU (unpaired two-tailed two sample Student’s t-test; at P14: cMU vs. CT, p=0.0025, t = 6.731), **p<0.01. (d, e) Linear correlation of g-ratio versus axon diameter (d) and of fiber diameter versus axon diameter (e), in the ventral white matter spinal cord of cMU compared to CT at P14. 100 myelinated axons per mouse analyzed in random fields selected in the same anatomical area, n = 3 mice for each, CT and cMU. (f) Representative EM images of P180 CT and cMU white matter from ventral funiculi of lumbar spinal cords. cMUs show more naked axons (false colored in orange) compared to CTs. cMU axons are encased by thinner myelin (examples indicated by arrows) compared to CTs. Scale bars: 5 μm. (g) Corresponding graph with quantification of percentage of not myelinated axons at P180. Data points represent n = 3 mice for each, CT and cMU, with at least 220 axons quantified per animal, in random fields selected in the same anatomical area (unpaired two-tailed two sample Student’s t-test; at P180: cMU vs. CT, p=0.0493, t = 2.791), *p<0.05. (h) Overall hypomyelination at P180 in cMU compared to CT, as shown by g-ratio analysis. Data points represent n = 3 mice for each, CT and cMU (unpaired two-tailed two sample Student’s t-test; at P180: cMU vs. CT, p=0.0027, t = 6.651), **p<0.01. (i, j) Linear correlation of g-ratio versus axon diameter (i) and of fiber diameter versus axon diameter (j), in the ventral white matter spinal cord of cMU compared to CT at P180. At least 65 myelinated axons per mouse analyzed in random fields selected in the same anatomical area, n = 3 mice for each, CT and cMU. Bars represent mean ±SEM. CT = control, cMU = conditional mutant.

Figure 3.

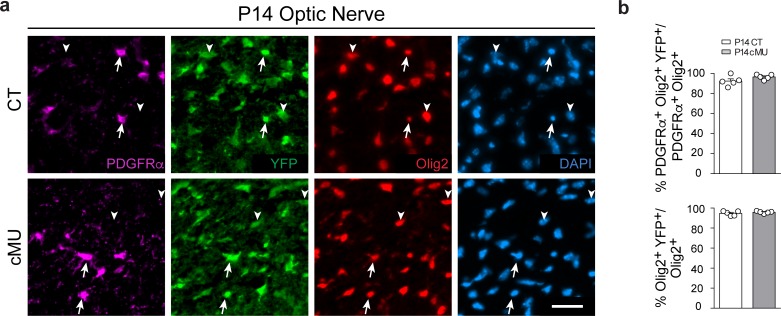
Figure 3—figure supplement 1. Recombination efficiency in the optic nerve.

Figure 3—figure supplement 1.

(a) Representative immunostaining of cross-sectioned optic nerves from P14 CT and cMU mice, n = 5 mice for each, CT and cMU. Cre-dependent expression of the reporter Rosa26-loxPstoploxP-YFP allele is detectable in oligodendrocyte lineage cells (Olig2+, examples indicated by arrowheads), including OPCs (PDGFRα+ and Olig2+, examples indicated by arrows). Nuclear marker: DAPI. Scale bar: 25 μm, applying to entire panel. (b) Corresponding graphs to (a) with quantification of percentage of recombined OPCs (PDGFRα+ Olig2+ YFP+) over total OPCs (PDGFRα+ Olig2+), and quantification of percentage of recombined oligodendrocyte lineage cells (Olig2+ YFP+) over total oligodendrocyte lineage cells (Olig2+). Data points represent n = 5 mice for each, CT and cMU; whole surface of 3 optic nerve sections were quantified per animal, with at least 19 PDGFRα+ YFP+ and at least 80 Olig2+ YFP+ cells quantified per section (unpaired two-tailed two sample Student’s t-test; for recombination frequency of OPCs: cMU vs. CT, p=0.1394, t = 1.641; for recombination frequency of oligodendrocyte lineage cells: cMU vs. CT, p=0.3650, t = 0.9603. Bars represent mean ±SEM. CT = control, cMU = conditional mutant.
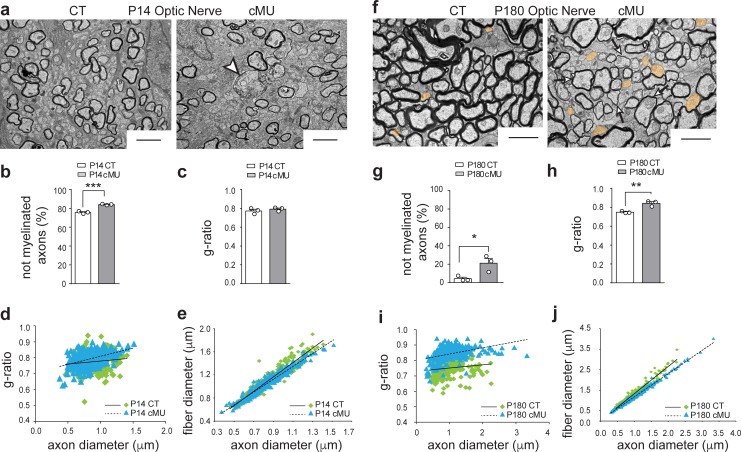
Figure 3—figure supplement 2. De novo fatty acid synthesis by oligodendrocytes is essential to achieve accurate myelination of the optic nerve.

Figure 3—figure supplement 2.

(a) Representative EM images of optic nerves from P14 control (CT) and conditional mutant (cMU) mice. Note the increased number of axons not-yet enwrapped by myelin in cMUs when compared to CTs. cMUs also display aberrant myelinated-axon profiles (example indicated by arrowhead). Scale bars: 2 μm. (b) Corresponding graph with quantification of the percentage of not myelinated axons at P14. Data points represent n = 3 mice for each, CT and cMU, with at least 4500 axons quantified per animal in random fields selected in the same anatomical area (unpaired two-tailed two sample Student’s t-test; at P14: cMU vs. CT, p=0.0006, t = 9.999), ***p<0.001. (c) g-ratio analysis. Data points represent n = 3 mice for each, CT and cMU (unpaired two-tailed two sample Student’s t-test; at P14: cMU vs. CT, p=0.4162, t = 0.906). (d, e) Linear correlation of g-ratio versus axon diameter (d) and of fiber diameter versus axon diameter (e) in optic nerves of cMU compared to CT at P14. 100 myelinated axons per mouse analyzed in random fields selected in the same anatomical area, n = 3 mice for each, CT and cMU. (f) Representative EM images of optic nerves from P180 CT and cMU mice. cMUs show more axons not-yet enwrapped by myelin (examples false colored in orange) when compared to CTs. cMU axons are also covered by thinner myelin (examples indicated by arrows) compared to CTs. Scale bars: 2 μm. (g) Corresponding graph with quantification of percentage of not myelinated axons at P180. Data points represent n = 3 mice for each, CT and cMU, with at least 1500 axons quantified per animal, in random fields selected in the same anatomical area (unpaired two-tailed two sample Student’s t-test; at P180: cMU vs. CT, p=0.0345, t = 3.15), *p<0.05. (h) Overall hypomyelination in cMU compared to CT at P180, as shown by g-ratio analysis. Data points represent n = 3 mice for each, CT and cMU (unpaired two-tailed two sample Student’s t-test; at P180: cMU vs. CT, p=0.0062, t = 5.269), **p<0.01. (i, j) Linear correlation of g-ratio versus axon diameter (i) and of fiber diameter versus axon diameter (j), in optic nerves of cMU compared to CT at P180. 100 myelinated axons per mouse analyzed, in random fields selected in the same anatomical area, n = 3 mice for each, CT and cMU. Bars represent mean ±SEM. CT = control, cMU = conditional mutant.
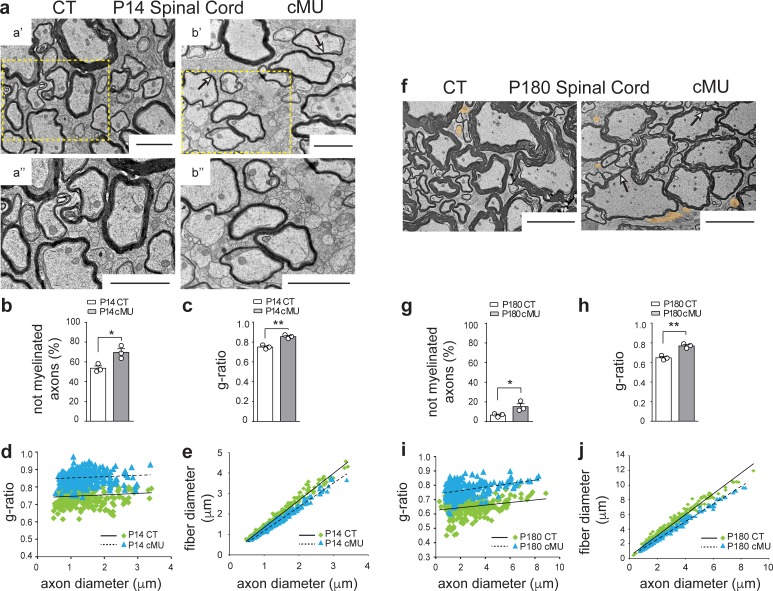
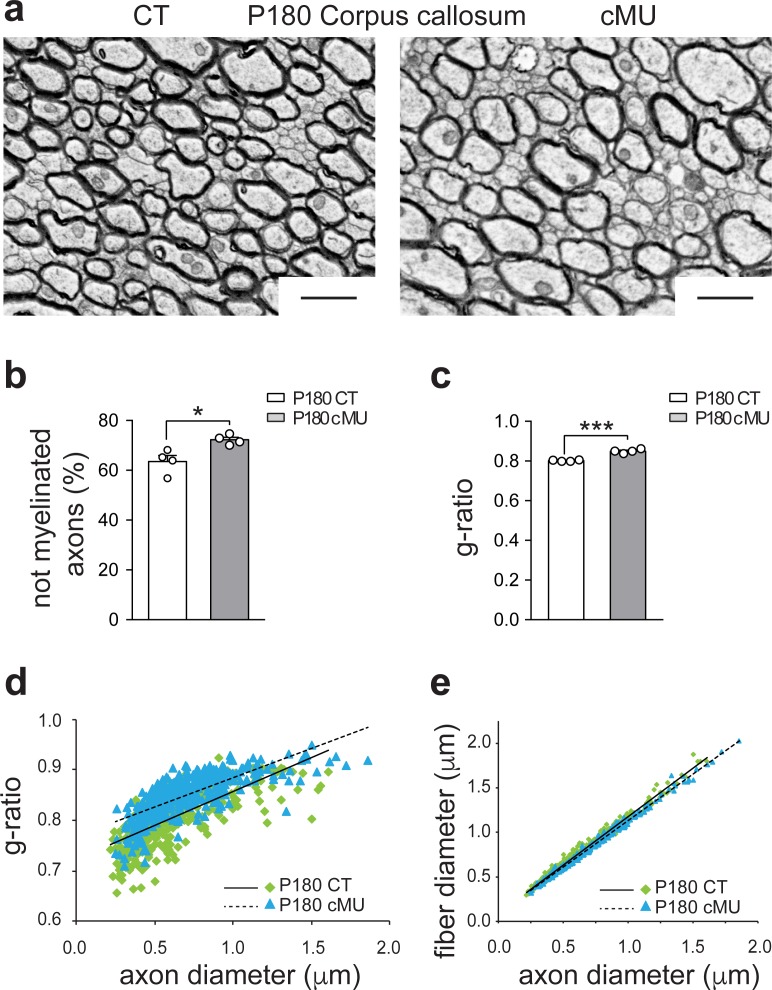
Figure 3—figure supplement 3. De novo fatty acid synthesis by oligodendrocytes is essential to achieve accurate myelination of the corpus callosum.

Figure 3—figure supplement 3.

(a) Representative EM images of corpus callosum from P180 CT and cMU mice. cMUs show slightly more axons not-yet enwrapped by myelin compared to CTs. cMU axons are also covered by thinner myelin compared to CTs. Scale bars: 1 μm (b) Corresponding graph with quantification of the percentage of not myelinated axons at P180. Data points represent n = 4 mice for each, CT and cMU, with at least 2243 axons quantified per animal in random fields selected in the same anatomical area (unpaired two-tailed two sample Student’s t-test; cMU vs. CT, p=0.0152, t = 3.362), *p<0.05. Bars represent mean ±SEM. (c) g-ratio analysis. Data points represent n = 4 mice for each, CT and cMU (unpaired two-tailed two sample Student’s t-test; cMU vs. CT, p<0.0001, t = 8.841), ***p<0.001. Bars represent mean ±SEM. (d, e) Linear correlation of g-ratio versus axon diameter (d) and of fiber diameter versus axon diameter (e) in corpus callosum of cMU compared to CT at P180. At least 100 myelinated axons per mouse analyzed in random fields selected in the same anatomical area, n = 4 mice for each, CT and cMU. CT = control, cMU = conditional mutant.