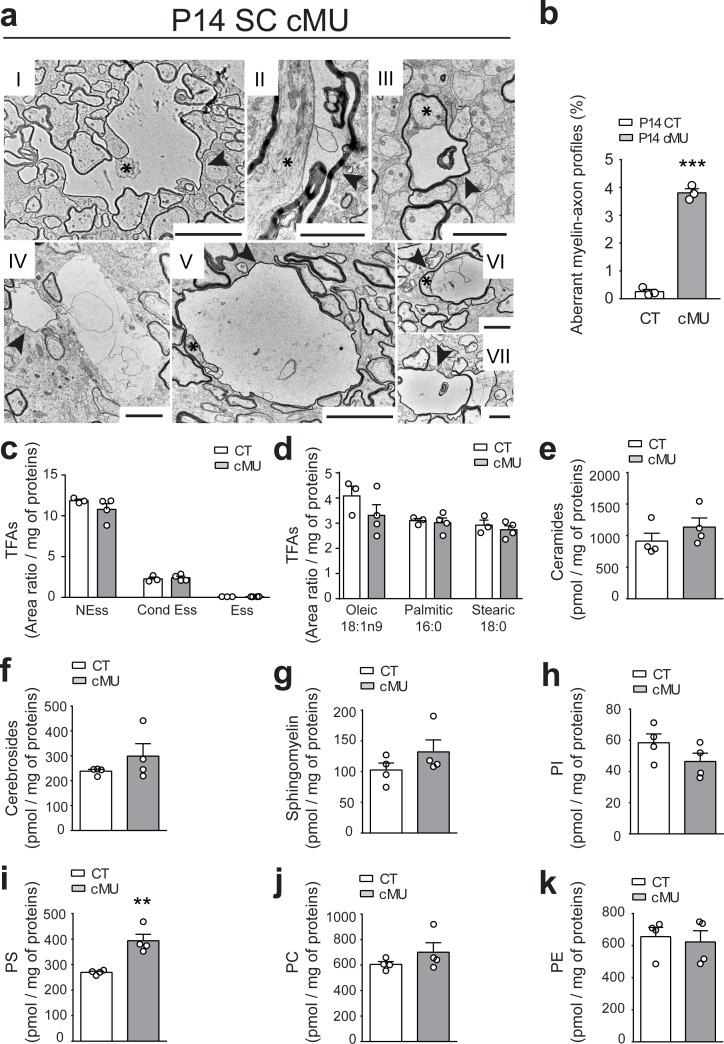
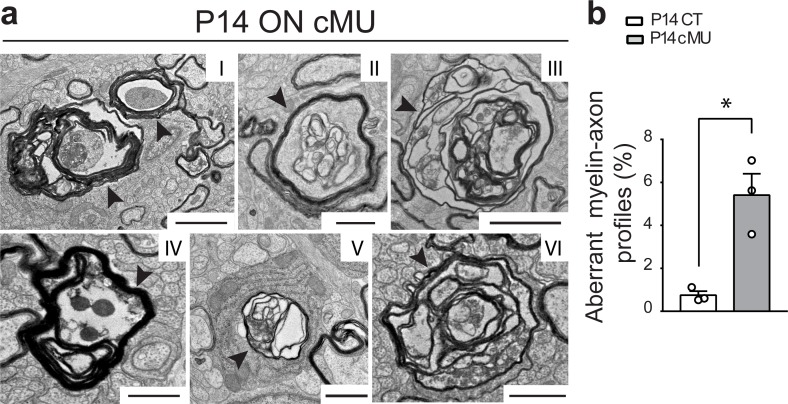
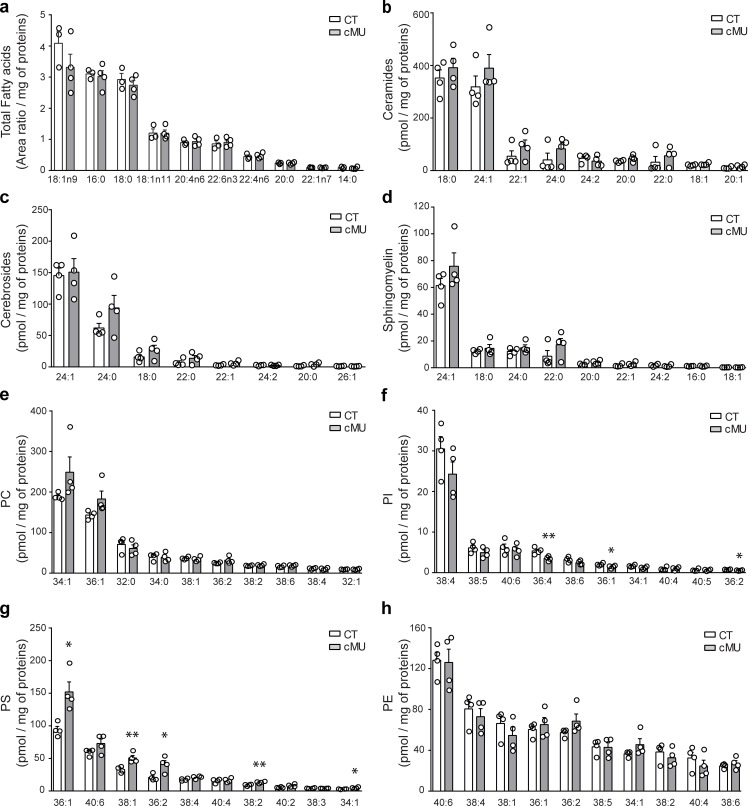
Figure 4. De novo fatty acid synthesis by oligodendrocytes is required to maintain structural stability of myelinated axons.
(a) Exemplary EM images of aberrant myelin-axon profiles showing vacuolation (examples indicated by arrowheads) in the ventral white matter of spinal cords of P14 cMUs. Where identifiable, axons associated with aberrant structures are indicated by asterisks. Scale bars: I = 5 µm, II = 2 µm, III = 2 µm, IV = 2 µm, V = 5 µm, VI = 2 µm, VII = 2 µm. (b) Corresponding graph with quantification of the percentage of aberrant myelin-axon profiles. Data points represent n = 3 mice for each, CT and cMU (unpaired two-tailed two sample Student’s t-test; at P14: cMU vs. CT p<0.0001, t = 21.16), ***p<0.001. At least 8300 axons per mouse analyzed in random fields selected in the same anatomical area. (c) Total FA composition of myelin purified from spinal cords of P60 CT and cMU mice, divided in non-essential FAs (NEss), conditional-essential FAs (Cond Ess) and essential FAs (Ess). Data points represent n = 3 mice for CT and n = 4 mice for cMU (unpaired two-tailed two sample Student’s t-test; NEss: cMU vs. CT, p=0.2609, t = 1.267; Cond Ess: cMU vs. CT, p=0.6625, t = 0.4635; Ess: cMU vs. CT, p=0.4435, t = 0.8317). (d) Quantification of the most abundant FAs found in myelin purified from spinal cords of CT and cMU mice. Data points represent n = 3 mice for CT and n = 4 mice for cMU (unpaired two-tailed two sample Student’s t-test; Oleic: cMU vs. CT, p=0.2525, t = 1.293; Palmitic: cMU vs. CT, p=0.7377, t = 0.3542; Stearic: cMU vs. CT, p=0.4966, t = 0.7328). (e, f, g) Content of ceramides (e), cerebrosides (f) and sphingomyelin (g) in myelin isolated from spinal cords of cMU compared to CT mice. Data points represent n = 4 mice for each, CT and cMU (unpaired two-tailed two sample Student’s t-test; ceramides: cMU vs. CT, p=0.2822, t = 1.181; cerebrosides: cMU vs. CT, p=0.2722, t = 1.209; sphingomyelin: cMU vs. CT, p=0.2310, t = 1.333). (h, i, j, k) Total content of phosphatidylinositols (PI), phosphatidylserines (PS), phosphatidylcholines (PC) and phosphatidylethanolamines (PE) in myelin isolated from spinal cords of CT and cMU mice. Data points represent n = 4 mice for each, CT and cMU (unpaired two-tailed two sample Student’s t-test; PI: cMU vs. CT, p=0.1765, t = 1.532; PS: cMU vs. CT, p=0.0031, t = 4.784; PC: cMU vs. CT, p=0.2698, t = 1.216; PE: cMU vs. CT, p=0.7236, t = 0.3706), **p<0.01. Bars represent mean ±SEM. CT = control, cMU = conditional mutant.


