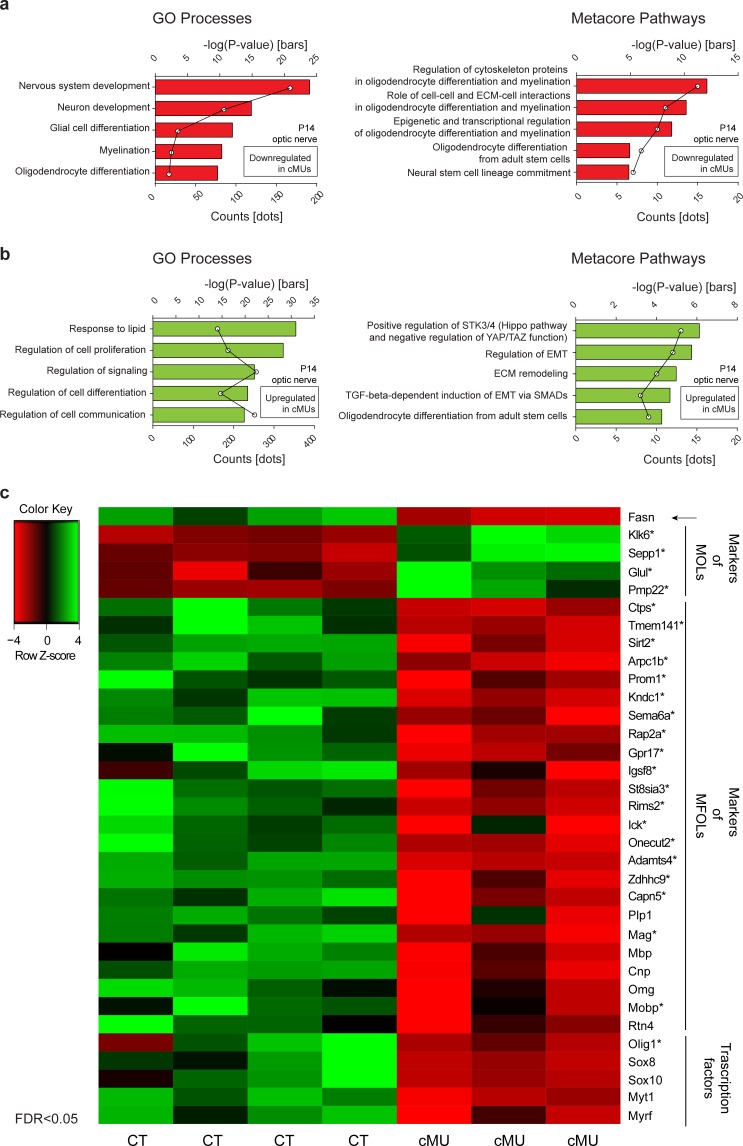
Figure 5. Transcriptome analysis of optic nerves of Fasn mutant mice reveal oligodendrocyte defects in late stages of maturation, including myelination.
(a, b) GeneOntology analysis depicting biological processes affected by down-regulated (a) and up-regulated (b) transcripts in P14 optic nerves of mutant (cMU) mice. Metacore Pathway analysis showing pathways affected by downregulated (a) and upregulated (b) transcripts in P14 optic nerves of cMU mice. Data points represent the count of regulated transcript for each category and pathway. (c) Heat map of RNA-seq data of CT and cMU optic nerves at P14, depicting Fasn and selected down- and up-regulated modulators of OL differentiation, maturation and myelination (FDR < 0.05). Markers identified by comparison with OLs single cell sequencing data (Marques et al., 2016) are marked with an asterisk. n = 3 mice for cMU, n = 4 mice for CT. CT = control, cMU = conditional mutant, MFOLs = myelin-forming oligodendrocytes, MOLs = mature oligodendrocytes (Marques et al., 2016).


