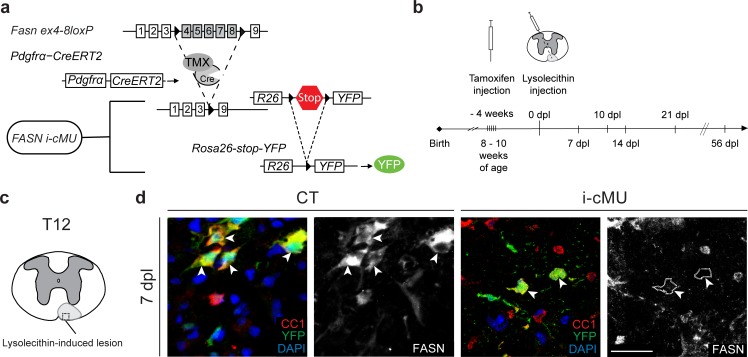
Figure 7. Generation of tamoxifen-inducible PdgfrαCreERT2:FASN-floxed conditionally mutant mice.
(a) Tamoxifen-mediated nuclear translocation of Pdgfrα-driven CreERT2 induces conditional Fasn allele inactivation (i-cMU) and expression of yellow fluorescent protein (YFP). (b) Timeline of de-/re-myelination experiments: Focal demyelination of the ventral spinal cord white matter was induced by injection of lysolecithin 4 weeks post-tamoxifen administration. The tissue was analysed 7, 10, 14, 21 and 56 days post-lysolecithin injection (dpl). (c) Schematic of lysolecithin-induced demyelinated focal lesion in the ventral funiculus of the thoracic spinal cord (level T12). Square insert indicates the area where immunostaining images were acquired. (d) Representative immunostainings of lesioned areas in cross-sectioned thoracic spinal cords from CT and i-cMU mice 7 dpl, n = 3 mice analyzed for each, CT and i-cMU. Note the prominent FASN expression in the cytoplasm of recombined aOPC-derived differentiated OLs (CC1+ YFP+ FASN+, examples indicated by arrowheads) in CT, but not in i-cMU (CC1+ YFP+ FASN-, examples indicated by dotted lines) lesions. Nuclear marker: DAPI. Scale bar: 20 μm, applies to entire panel. CT = control, i-cMU = inducible conditional mutant, dpl = days post-lysolecithin injection.


