. 2019 May 7;8:e44702. doi: 10.7554/eLife.44702

Figure 8. De novo fatty acid synthesis is required for maintaining the adult oligodendrocyte progenitor-derived oligodendrocyte population during remyelination.

(a) Representative immunostaining of lesions of control (CT) and inducible conditional mutant (i-cMU) mice on cross sections of ventral white matter of the spinal cord at 7, 10, 14 and 21 days post-lysolecithin injection (dpl), n = 5 mice for each, CT and i-cMU. Images depict recombined aOPC-derived differentiated OLs (CC1+ Olig2+ YFP+, examples indicated by arrowheads). Scale bar: 20 μm, applies to entire panel. (b, c) Corresponding graphs with quantification of (b) recombined OLs (Olig2+ YFP+) and (c) recombined aOPC-derived differentiated OLs (CC1+ Olig2+ YFP+) in lesion areas of ventral spinal cord white matter of CT and i-cMU mice at 7, 10, 14 and 21 dpl. Data were normalized per area. Data points represent n = 5 mice for each, CT and i-cMU. Lesion areas of at least 4 sections quantified per animal (2-way Anova; (b) Genotype: p<0.0001, F1,32= 30.28; (c) Genotype: p<0.0001, F1,32= 84.52; with Tukey’s multiple comparisons test; (b) 7 dpl: i-cMU vs. CT, p=0.9829; 10 dpl: i-cMU vs. CT, p=0.6132; 14 dpl: i-cMU vs. CT, p<0.0001; 21 dpl: i-cMU vs. CT, p=0.0071; (c) 7 dpl: i-cMU vs. CT, p=0.9971; 10 dpl: i-cMU vs. CT, p=0.0900; 14: i-cMU vs. CT, p<0.0001; 21 dpl: i-cMU vs. CT, p<0.0001), ***p<0.001, **p<0.01. Bars represent mean ± SEM. CT = control, i-cMU = inducible conditional mutant, dpl = days post-lysolecithin injection.

Figure 8.

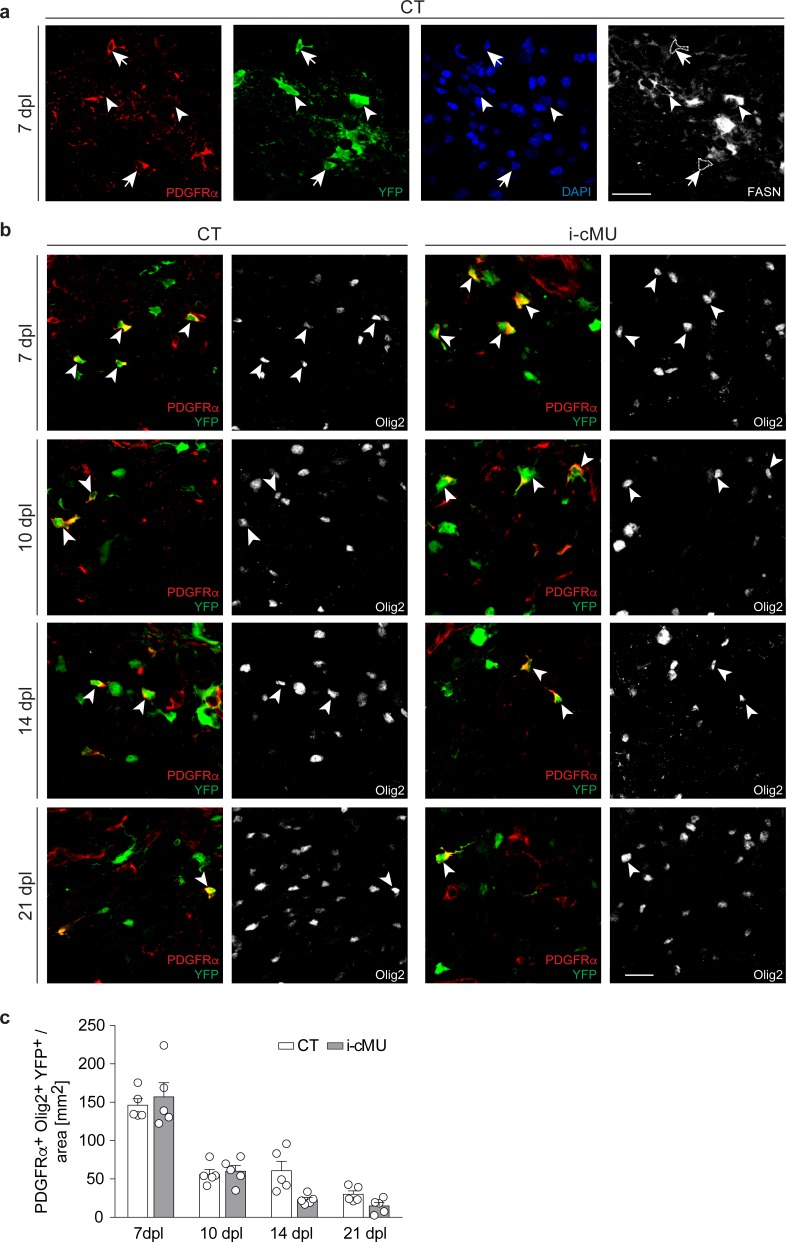
Figure 8—figure supplement 1. FASN expression in adult oligodendrocyte progenitors is marginal and largely dispensable for their response following demyelination.

Figure 8—figure supplement 1.

(a) Representative immunostaining of the lesion area in cross sections of the spinal cord of induced control (CT) mice at 7 days post-lysolecithin injection (dpl). Images depict marginal expression of FASN in recombined aOPCs (PDGFRα+ YFP+, examples indicated by arrows, FASN- cells outlined) compared to differentiated aOPC-derived OLs (PDGFRα- YFP+, examples indicated by arrowheads). n = 5 analyzed CT mice. Scale bar: 20 μm. (b) Representative immunostainings of the lesion area in cross sections of the spinal cord at 7, 10, 14 and 21 dpl from CT and induced conditional mutant (i-cMU) mice, n = 5 mice for each, CT and i-cMU. Images depict recombined aOPCs (PDGFRα+ Olig2+ YFP+, examples indicated by arrowheads). Scale bar: 20 μm, applies to entire panel. (c) Corresponding graph with quantification of recombined aOPCs (PDGFRα+ Olig2+ YFP+) in the lesion area of CT and i-cMU mice at 7, 10, 14 and 21 dpl. Data were normalized per area. Data points represent n = 5 mice for each, CT and i-cMU. Lesion areas from at least 4 sections quantified per animal (2-way Anova; Genotype: p=0.1589, F1,32= 2.081; with Tukey’s multiple comparisons test; 7 dpl: i-cMU vs. CT, p=0.9907; 10 dpl: i-cMU vs. CT, p>0.9999; 14 dpl: i-cMU vs. CT, p=0.1175; 21 dpl: i-cMU vs. CT, p=0.9420). Bars represent mean ± SEM. CT = control, i-cMU = inducible conditional mutant, dpl = days post lysolecithin injection.
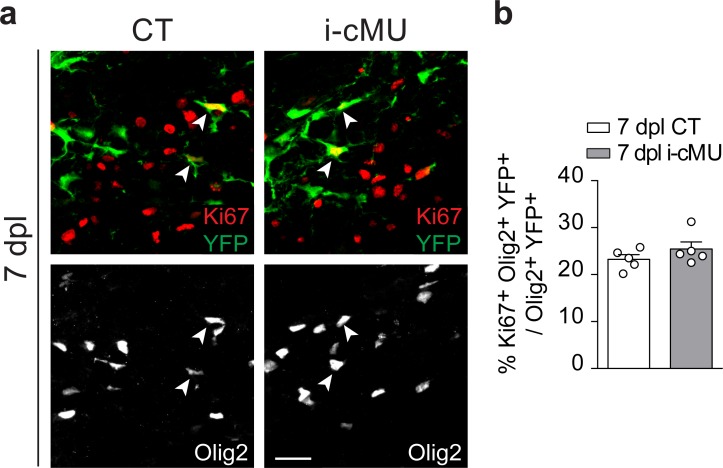
Figure 8—figure supplement 2. FASN expression is dispensable for the proliferation of oligodendrocytes lineage cells in remyelination.

Figure 8—figure supplement 2.

(a) Representative immunostaining in the lesion area of cross-sectioned thoracic spinal cords of control (CT) and inducible conditional mutant (i-cMU) mice at 7 dpl. n = 5 mice for each, CT and i-cMU. Images depict proliferating recombined OL lineage cells (Ki67+ Olig2+ YFP+, examples indicated by arrowheads). Scale bar: 20 μm, applies to entire panel. (b) Corresponding graph with quantification of the percentage of proliferative recombined OL lineage cells (Ki67+ Olig2+ YFP+) over total recombined OL lineage cells (Olig2+ YFP+) in the lesion area in cross sections of thoracic spinal cords at 7 dpl, from CT and i-cMU mice. Data points represent n = 5 mice for each, CT and i-cMU. Lesion areas from at least 4 sections quantified per animal (unpaired two-tailed two sample Student’s t-test; i-cMU vs. CT: p=0.2636, t = 1.202). Bars represent mean ±SEM. CT = control, i-cMU = inducible conditional mutant, dpl = days post-lysolecithin injection.
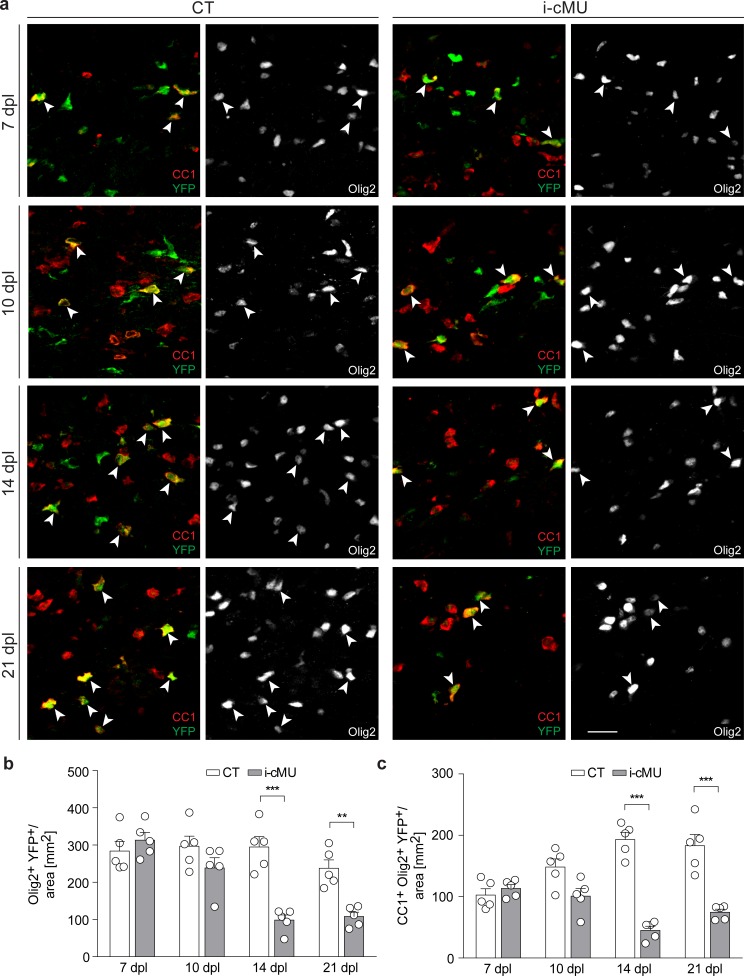
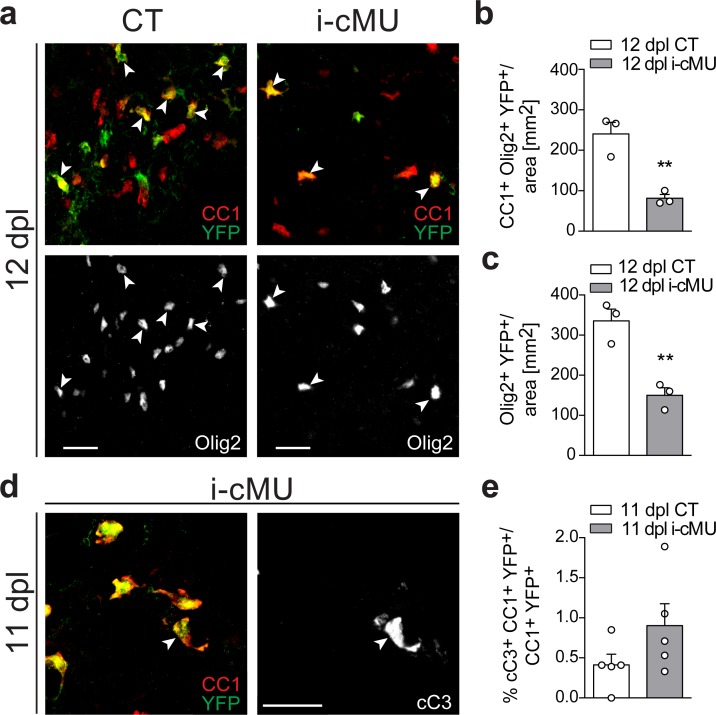
Figure 8—figure supplement 3. FASN is critical to sustain adult oligodendrocyte progenitor-derived oligodendrocytes during remyelination.

Figure 8—figure supplement 3.

(a) Representative immunostaining of the lesion area in cross sections of the thoracic spinal cord at 12 days post-lysolecithin injection (dpl) from control (CT) and inducible conditional mutant (i-cMU) mice, n = 3 mice for each, CT and i-cMU. Images depict recombined aOPCs-derived differentiated OLs (CC1+ Olig2+ YFP+, examples indicated by arrowheads). Scale bar: 20 μm. (b, c) Corresponding graph with quantification of (b) recombined aOPCs-derived differentiated OLs (CC1+ Olig2+ YFP+) and (c) recombined OL lineage cells (Olig2+ YFP+) in the lesion of CT and i-cMU mice 12 dpl. Data were normalized to the area. Data points represent n = 3 mice for each, CT and i-cMU. Lesion areas of at least 4 sections quantified per animal (unpaired two-tailed two sample Student’s t-test; (b): i-cMU vs. CT, p=0.0060, t = 5.319, (c): i-cMU vs. CT, p=0.0059, t = 5.341), **p<0.01. (d) Exemplary immunostaining of the lesion area in cross sections of the thoracic spinal cord of i-cMU mice at 11 dpl. Images depict an exemplary apoptotic recombined differentiated OL, expressing cleaved caspase 3 (cC3+ CC1+ YFP+, example indicated by arrowhead). Scale bar: 20 μm. (e) Corresponding graph with quantification of the percentage of apoptotic recombined differentiated OLs (cC3+ CC1+ YFP+) over total recombined differentiated OLs (CC1+ YFP+) in the lesion area of CT and i-cMU mice, 11 dpl. Data points represent n = 5 mice for each, CT and i-cMU. At least 14 sections quantified per animal (unpaired two-tailed two sample Student’s t-test; i-cMU vs. CT: p=0.1470, t = 1.606). Bars represent mean ± SEM. CT = control, i-cMU = inducible conditional mutant, cC3 = cleaved caspase 3, dpl = days post-lysolecithin injection.