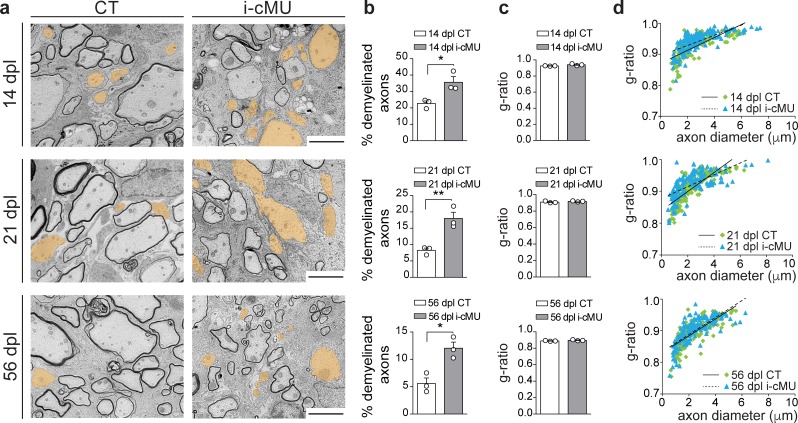
Figure 9. De novo fatty acid synthesis is essential to achieve efficient remyelination in the spinal cord.
(a) Representative EM images of lesions in the spinal cord of control (CT) and inducible conditional mutant (i-cMU) mice during remyelination at 14, 21 and 56 days post-lysolecithin injection (dpl). i-cMUs show persistently increased numbers of demyelinated axons (examples false colored in orange) compared to CTs up to 56 dpl. Scale bars: 3 μm. (b) Corresponding graphs with quantification of percentage of demyelinated axons within the remyelinated lesion area at 14, 21 and 56 dpl. Data points represent n = 3 mice for each, CT and i-cMU. The entire lesion area was quantified, at least 550 axons counted per animal (unpaired two-tailed two sample Student’s t-test; 14 dpl: i-cMU vs. CT, p=0.0263, t = 3.439; 21 dpl: i-cMU vs. CT, p=0.0086, t = 4.803; 56 dpl: i-cMU vs. CT, p=0.0127, t = 4.290), *p<0.05, **p<0.01. (c) g-ratio analysis of remyelinated fibers at 14, 21 and 56 dpl in i-cMU compared to CTs. Data points represent n = 3 mice for each, CT and i-cMU (unpaired two-tailed two sample Student’s t-test; 14 dpl: i-cMU vs. CT, p=0.1146, t = 2.011; 21 dpl: i-cMU vs. CT, p=0.3146, t = 1.149; 56 dpl: i-cMU vs. CT, p=0.1481, t = 1.789). (d) Linear correlation of g-ratio versus axon diameter in remyelinating lesions of i-cMU compared to CT mice, at 14, 21 and 56 dpl. At least 50 myelinated axons per mouse analyzed, n = 3 mice for each, CT and i-cMU. Bars represent mean ± SEM. CT = control, i-cMU = inducible conditional mutant, dpl = days post-lysolecithin injection.

