
Figure 2.
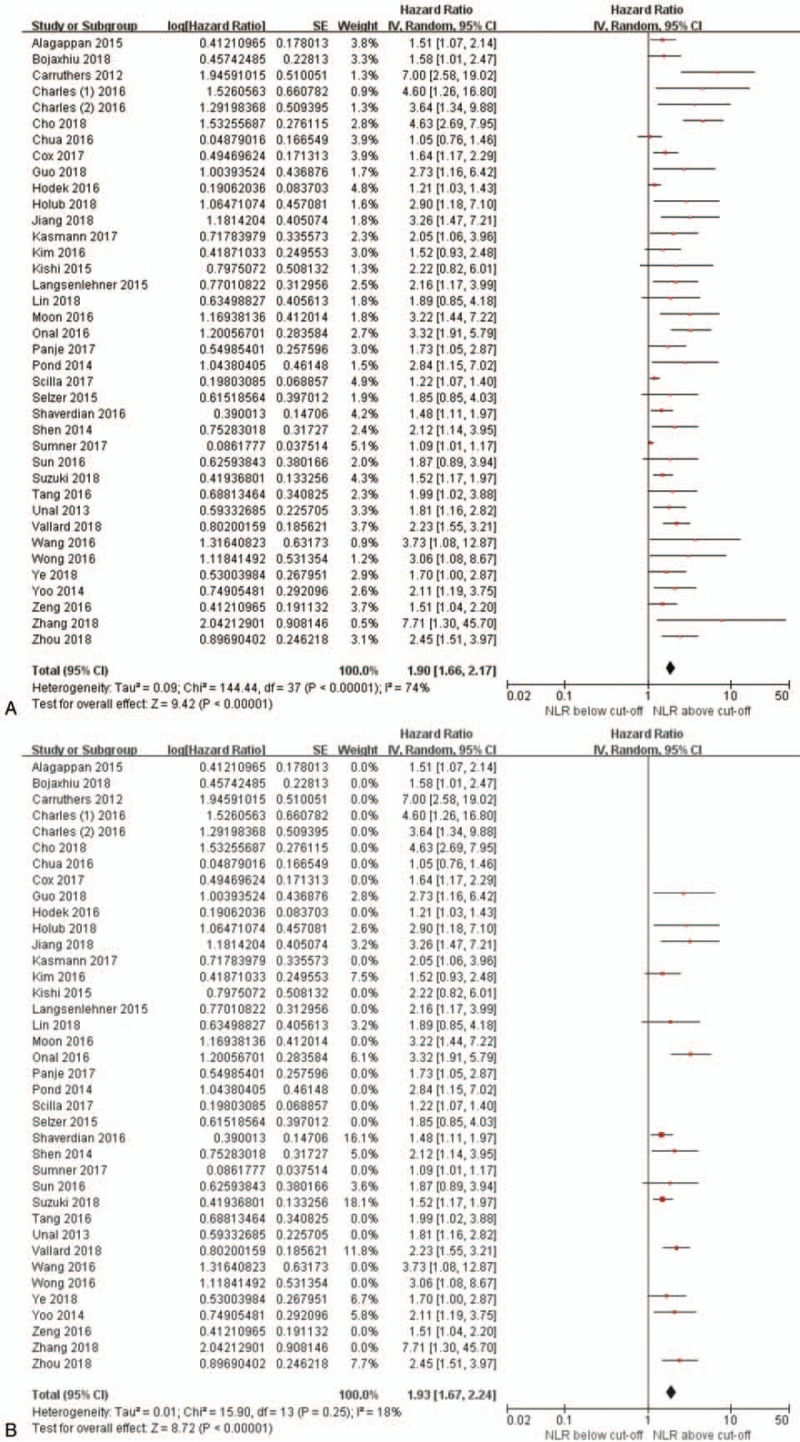
Forest plots showing hazard ratios for overall survival between pretreatment NLR greater than or less than the cut-off value in (A) all studies and (B) studies based on data from multivariate analysis and receiver operating characteristic curves.