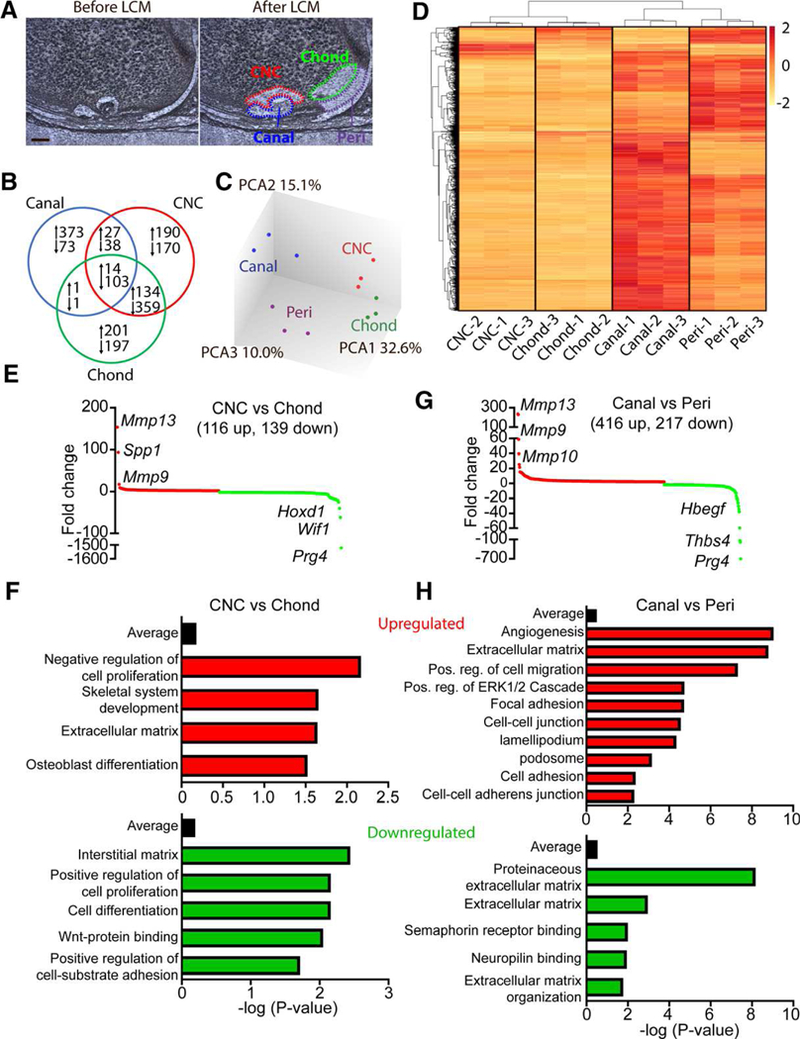
Figure 7.

Gene expression analyses associated with canal initiation and progression. (A): Laser capture microdissection was used to dissect the canal, chondrocytes near the canal (CNC), periarticular region (peri) and underlying chondrocytes (chond). Bar = 50 μm. (B): Gene expression analyses, with peri as the control tissue, showed 1,881 significantly regulated genes across the three isolated tissues. (C): PCA confirmed clustering of individual samples and showed notable changes between the peri and canal whereas more modest changes were observed between the CNC and chond. (D): Heat map of the 1,200 most regulated genes show robust gene expression changes during canal formation. (E): Differential expression profiles of significantly regulated genes from CNC relative to epiphyseal chondrocytes. Red denotes upregulated genes whereas green represents downregulated genes. Some of the most highly regulated genes have been listed. (F): Enrichment analysis of GO terms up and down-regulated in the CNC versus epiphyseal chondrocytes. (G): Differential expression profiles of significantly regulated genes from the canal relative to the periarticular region. Red denotes upregulated genes whereas green represents downregulated genes. Some of the most highly regulated genes have been listed. (H): Enrichment analysis of GO terms up and downregulated in the canal versus the periarticular region (n = 3).
