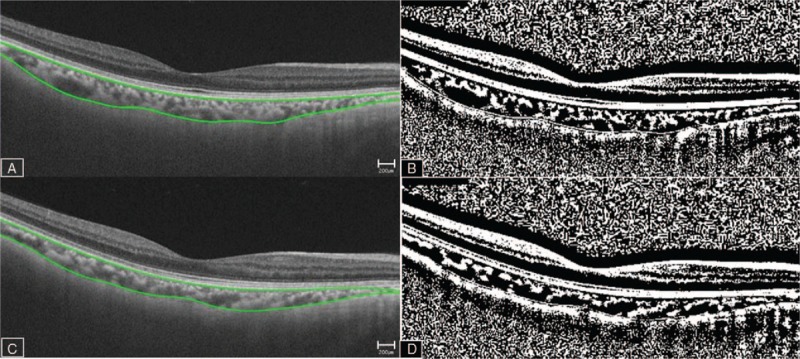
Figure 1.

Image binarization for the choroid. Swept-source optical coherence tomography image acquired before (A, B) and after (C, D) hemodialysis. Each scan is binarized using the ImageJ software (B, D). The LA is defined as the area with dark pixels. The SA is defined as the area with light pixels. The TCA of interest is calculated by multiplying the standard width of 150 μm (75 μm on either side of the fovea) by (SFCT; between Bruch's membrane and the chorio-scleral interface). The average of the LA, SA, and SFCT of the horizontal and vertical scans are used. The choroidal vascularity index is calculated as the ratio of the LA to the TCA. LA = luminal area, SA = stromal area, SFCT = subfoveal choroidal thickness, TCA = total choroidal area.
