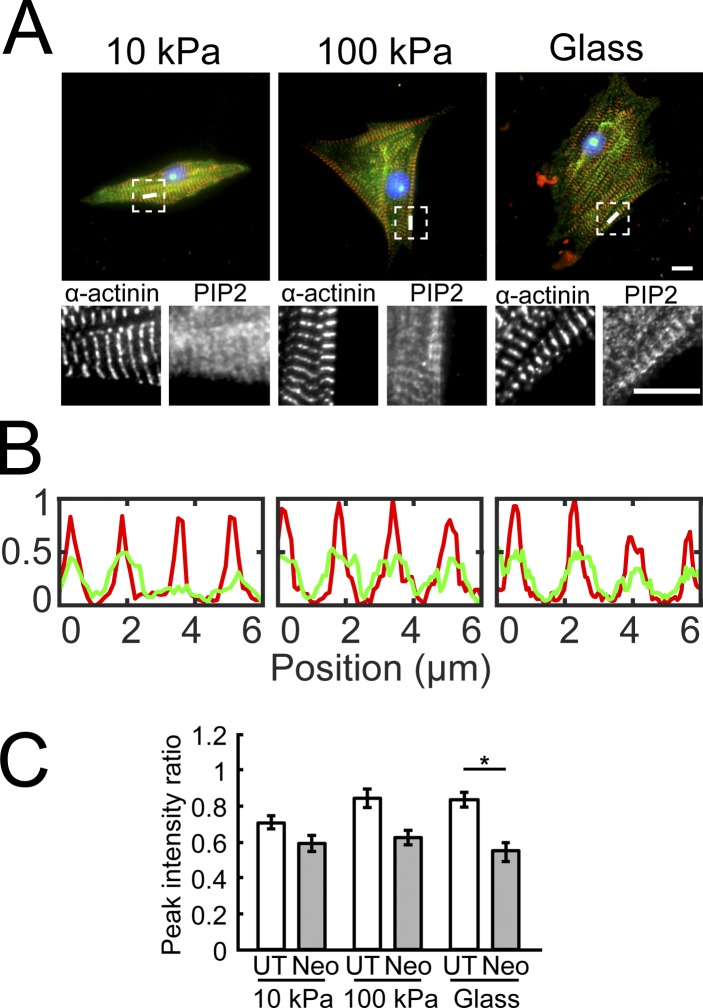
Figure 4.
PIP2 localization in the Z-lines in neonatal myocytes grown on varying stiffness and with neomycin treatment. (A) NRVMs plated on PAA substrates (10 kPa and 100 kPa) or glass were fixed and stained for α-actinin (red) and PIP2 (green). Dashed squares are enlarged in lower panels to show separate α-actinin and PIP2 fluorescence images. Scale bars, 10 µm. (B) Line scans corresponding to white lines in A depict PIP2 (green) localization in the Z-lines represented by α-actinin (red). (C) Peak PIP2 to α-actinin intensity ratio quantifies the effect of neomycin and stiffness on PIP2 localization in the Z-lines (mean ± SEM, n = 15–21; *, P < 0.05).

