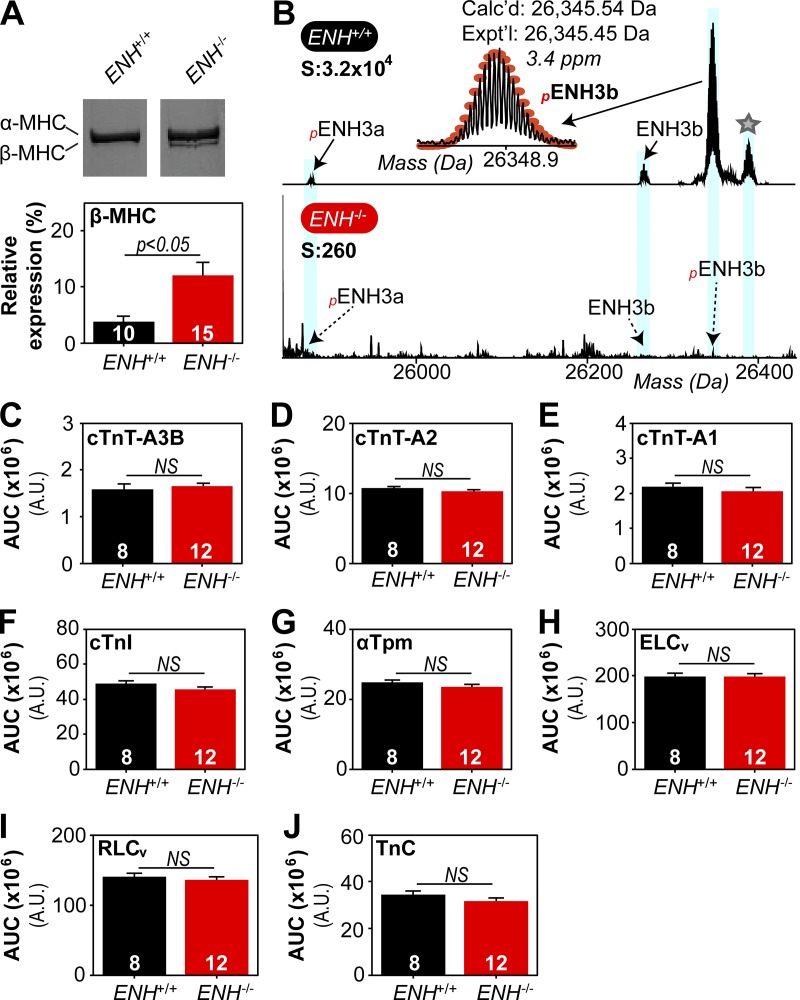
Figure 3.
The expression of MHC isoforms, but not other thin/thick filament regulatory proteins, is altered in ENH−/− mouse myocardium. (A) Representative silver-stained gels showing expression profile of myosin heavy chain isoforms (top) and associated quantification (bottom) in ENH+/+ and ENH−/− trabeculae. (B) Zoomed-in deconvoluted mass spectrum showing ENH protein species detected in ENH+/+, but not ENH−/−, mouse myocardium. Star denotes potential acetylated form of pENH3b (ΔM = 42.00 Da). (C–J) Top-down proteomics quantification of thin/thick filament protein expression in the ventricular myocardium of ENH+/+ and ENH−/− mice. Each data point is the mean and error bar the SEM.

