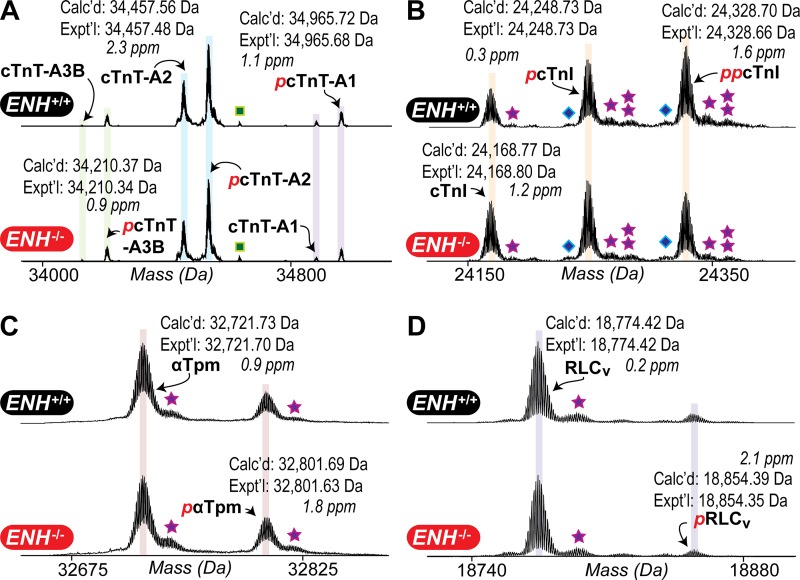
Figure 4.
Top-down proteomic analysis of contractile protein phosphorylation in ENH+/+ and ENH−/− mouse myocardium. (A–D) Representative zoomed-in deconvoluted mass spectra showing the relative intensities of unmodified and modified forms of cTnT isoforms (A), cTnI (B), αTpm (C), and RLCv (D) in ENH+/+ and ENH−/− mouse myocardium. Reported masses are the most abundant masses. Squares, stars, and diamonds denote peaks corresponding to proteins associated noncovalently with phosphoric acid (+H3PO4), proteins associated noncovalently with sodium ions (+Na+), and proteins displaying a 62-Da mass increase relative to the unmodified and modified protein species, respectively.

