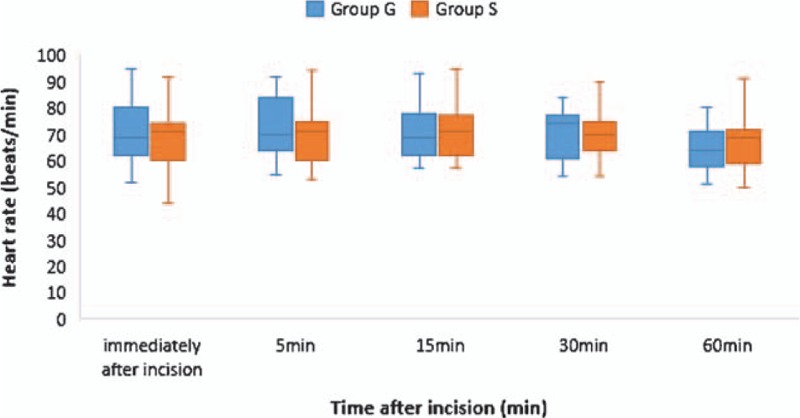
Figure 3.

Time course of heart rate. The box-and-whisker plot shows the values immediately and 5, 15, 30, and 60 minutes after incision. The middle line in the box represents median value, the upper and lower margins of the box represent first and third quartiles, respectively, and the whiskers represent the minimum and maximum values. There was no significant difference between Group G and Group S. Group G, patients who received general anesthesia alone; Group S, patients who received a combination of general anesthesia and serratus plane block.
