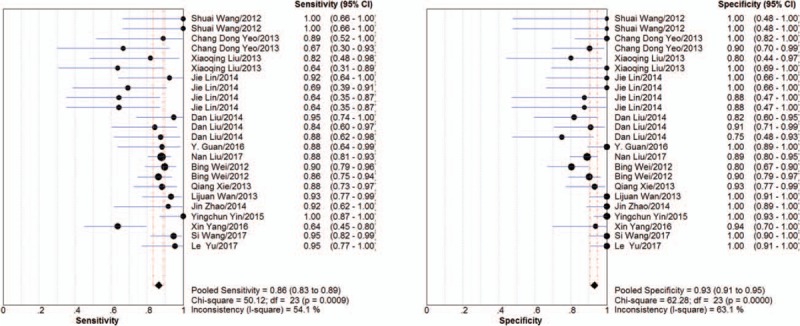
Figure 3.

Forest plot of the summary sensitivity and specificity of pleural effusion. The sensitivity/specificity of individual study is represented by a circle, through which runs a horizontal line (95% CI). The diamond at the bottom represents the pooled sensitivity/specificity from the studies. df = degrees of freedom.
