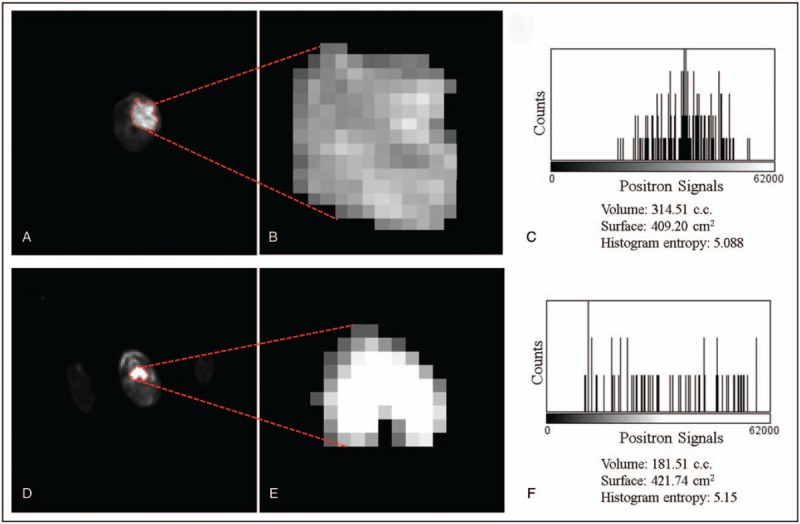
Figure 3.

Two slices of PET which show the FDG uptake from 2 patients with oropharynx (A–C) and hypopharynx (D–F) tumors, respectively. A and D show the original PET images with the delineation (red dashed lines). B and E show the zoomed images of the segmented tumor. C and F show the histogram of the positron signal versus the photon counting. FDG = fluorodeoxyglucose, PET = positron emission tomography.
