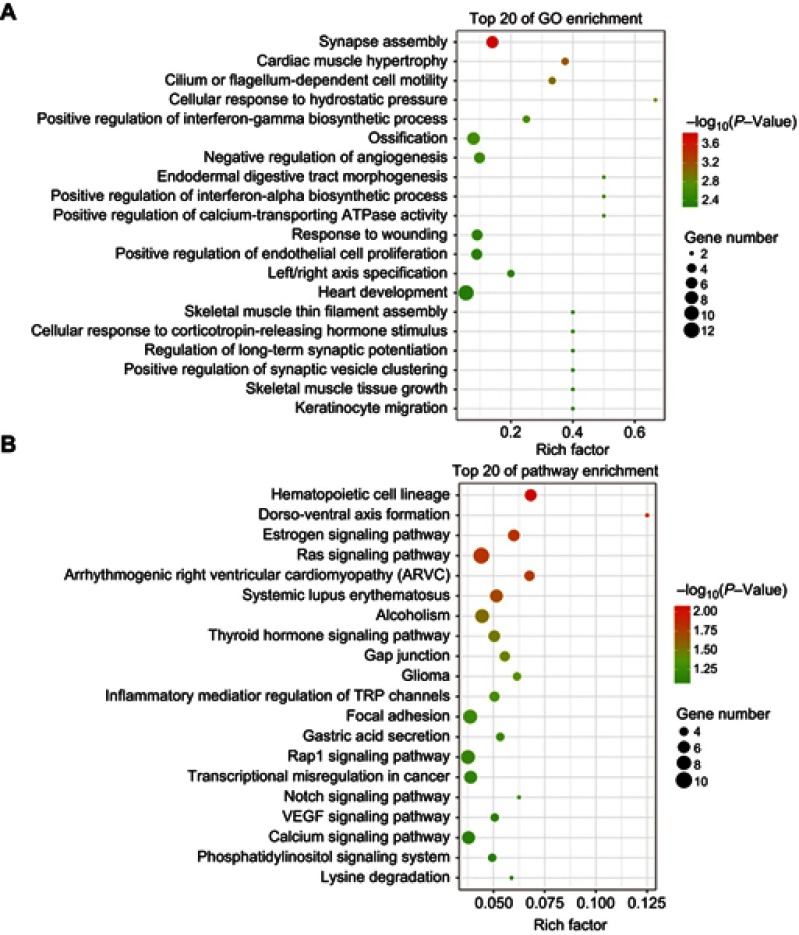
Figure 5.
Scatter plot for GO term enrichment analysis and KEGG enrichment of DEGs. (A)The top 20 of GO enrichment after transfecting MDA-MB-231 cells with tsRNA-26576 inhibitor are displayed in the senior bubble chart. The size of the black circle measures the unigene number. Each different color indicates a different P-value used for significance verification. (B) The top 20 enrichment KEGG pathways after transfecting MDA-MB-231 cells with tsRNA-26576 inhibitor are displayed in the senior bubble chart. Rich factors are shown as the proportion of DEGs numbers to all gene numbers that are annotated in this pathway term. The size of the black circle indicates the unigene number. Each different color indicates a different P-value used for significance verification.
Abbreviation: DEG, differently expressed genes.

