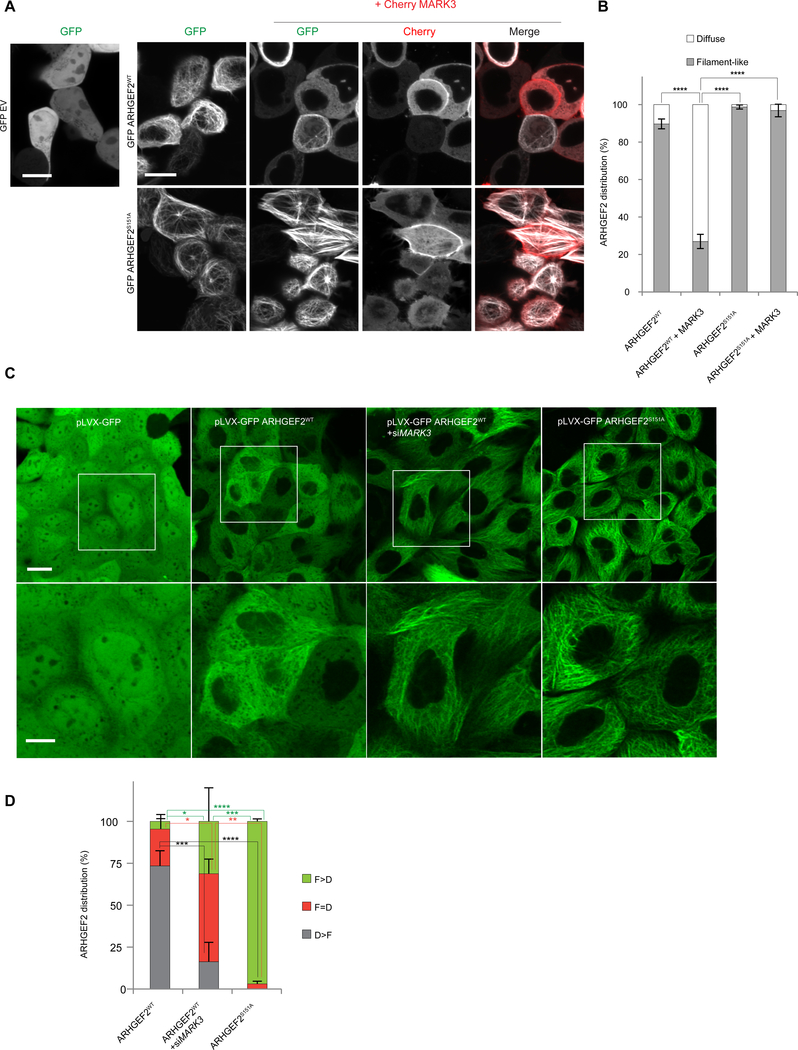
Figure 6. MARK3 affects the localization of ARHGEF2 dependent on Ser151 and 14-3-3.
(A, B) Live imaging pictures of HEK293T cells. In A, top panel, cells transiently overexpressing GFP alone, GFP-ARHGEF2wt alone or in combination with Cherry-MARK3; bottom panel cells expressing GFP- ARHGEF2S151A alone or co-expressed with Cherry-MARK3. ARHGEF2 distribution in A is quantified in B (as percentage of cells). A total of n=100–200 cells per condition were counted. Data are means ± SD of three independent experiments (n=3). Scale bar, 10 μm. Statistical significance was determined by a two way ANOVA test with a Bonferroni posttest correction for multiple comparisons. ****P≤0.0001.
(C, D) Live imaging of MDCKII cells stably expressing inducible pLVX-GFP, pLVX-GFP ARHGEF2WT, pLVX-GFP ARHGEF2S151A and pLVX-GFP ARHGEF2WT in combination with siMARK3; zoomed regions shown in bottom panels. In (D) quantification, as percentage of cells, of images shown in (C): cells having a higher tendency of showing a filament-like distribution (F>D); a higher tendency of having a diffuse distribution (D>F) or similar distribution of filament-like and diffuse appearing structures (D=F). F (Filament-Like distribution); D (Diffuse distribution). A total of n=250–300 cells per condition were counted. Data are means ± SD of three independent experiments. Scale bar 20 μm (upper images), 10 μm (lower images). Statistical significance was determined by a two way ANOVA test with a Bonferroni post-test correction for multiple comparisons. *P=0.0470 (in F>D ARHGEF2wt VS ARHGEF2WT+siMARK3); *P=0.0235 (in F=D ARHGEF2WT VS ARHGEF2WT+siMARK3); **P=0.0014; ***P=0.0002 (in F>D ARHGEF2WT + siMARK3 VS ARHGEF2S151A); ***P=0.0005 (in D>F ARHGEF2wt VS ARHGEF2WT+siMARK3); ****P≤0.0001.

