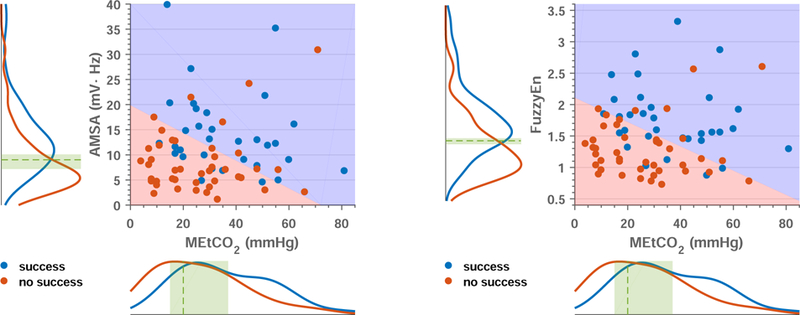
Figure 4.

Analysis of the models for the prediction of first shock success based on VF-waveform features combined with MEtCO2. The scatter plots show how the pair of values for each shock are distributed, and in both cases successful shocks (blue dots) fall in the north-east side indicating that they correspond to high values of MEtCO2 and the VF-waveform predictor. Unsuccessful shocks (red dots) concentrate in the south-west corner, corresponding to low values of MEtCO2 and the VF-waveform predictor. The blues and red areas are separated by the median decision boundary corresponding to 100 replicas of the logistic regression classifier. The curves on the sides are a non-parametric estimation of the probability distribution of each variable (AMSA left, FuzzyEn right, and MEtCO2 bottom) for successful (blue) and unsuccessful (red) shocks. The dashed green line and area indicate the median (IQR) of the thresholds for 100 replicas, corresponding to AMSA, 9.0 (7.2–10.1) mVHz, FuzzyEn, 1.4 (1.4–1.5), and MEtCO2, 20 (15–37) mmHg, respectively.
