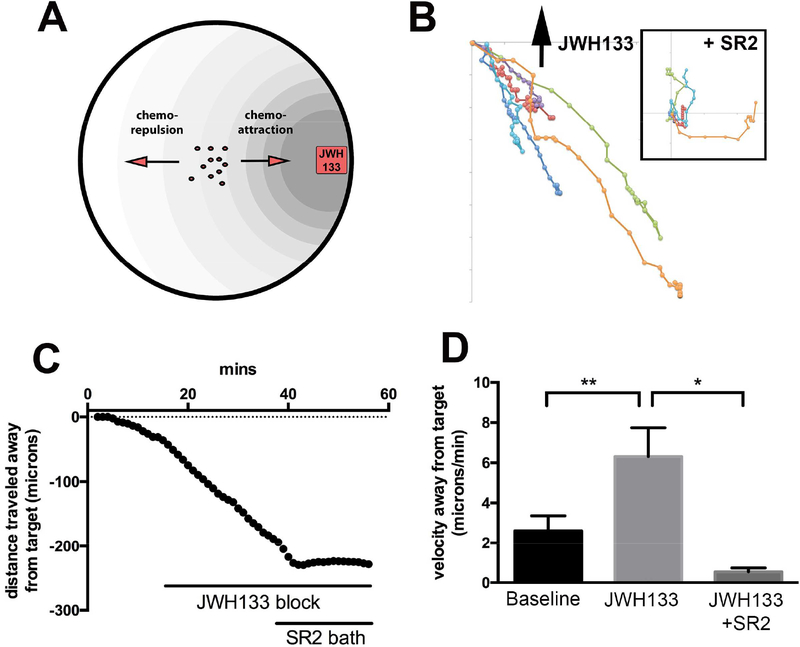
Figure 1. CB2R activation mediates chemorepulsion in bovine corneal epithelial cells.
A) Schematic illustrating in-dish migration assay with drug- embedded agar block. B) Cell tracking from representative experiment. Direction of agar block indicated by arrow. Inset shows subsequent migration of same cells after bath application of SR2, with starting points normalized to the origin to facilitate comparison. C) Net distance traveled relative to agar cube containing JWH133 (300nM), before and after bath application of CB2R antagonist SR144528 (SR2, 250nM). D) Bar graph summarizes velocities away from target. *, p<0.05, **, p<0.01, One-way ANOVA with Bonferroni post hoc test.

