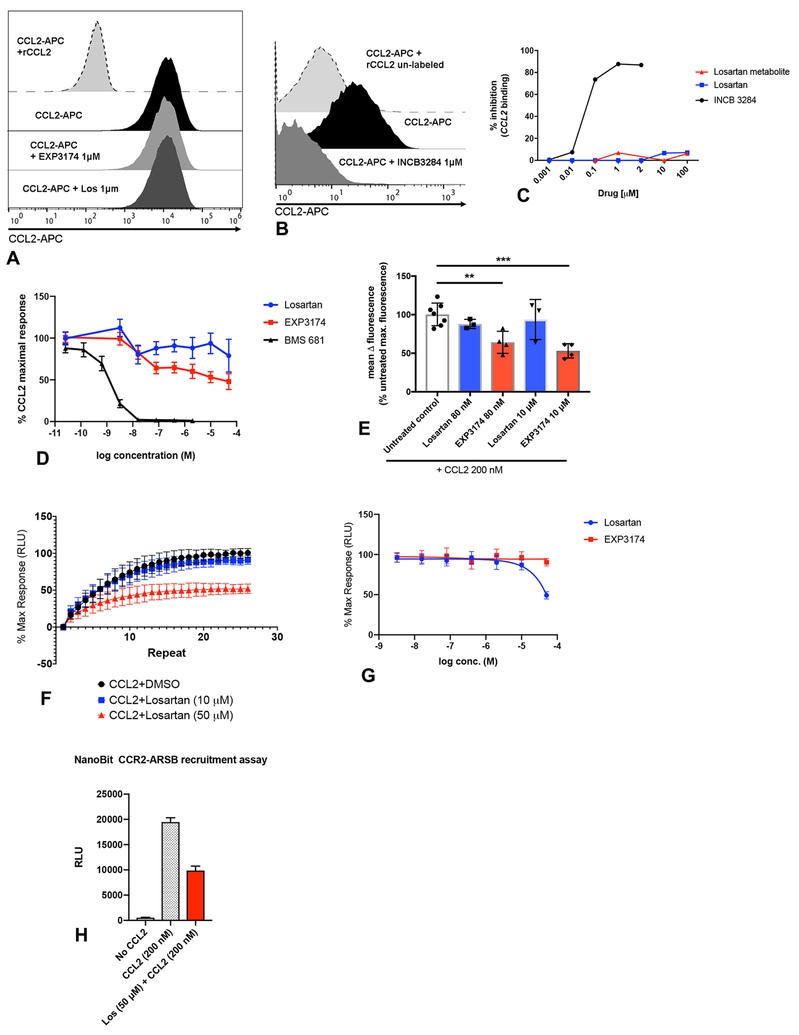
Figure 2.
Losartan and its EXP3174 metabolite do not block CCL2 binding or CCL2-induced cytoplasmic Ca2+ release in THP-1 monocytes. (A-C) CCL2 binding was assessed by flow cytometry using fluorescently labeled human rCCL2 (CCL2-APC). (A) Representative histograms showing complete lack of inhibition of CCL2 ligand binding by losartan or EXP3174 metabolite, which is in striking contrast to the orthosteric CCR2 antagonist, INCB3344 shown in B. (C) Dose-response curve of % inhibition of CCL2 binding for losartan, EXP3174 metabolite, and INCB3344, as determined by flow cytometry, across a range of drug concentrations. (D) Dose-response curve of calcium mobilization in CCR2-expressing HEK293 cells in response to 200 nM CCL2 +/− 1hr pre-treatment with the indicated concentrations of losartan, EXP3174, or the orthosteric CCR2 antagonist BMS681. Cells were loaded with FLIPR calcium-sensitive dye to detect CCL2-induced calcium flux over time using the kinetics measurement function of a fluorescent plate reader. (E) Quantitative bar graph of inhibition of CCL2-stimulated calcium mobilization by losartan and EXP-3174, as % of untreated positive control cells. **p < 0.01, ***p < 0.001, one-way ANOVA. Data representative of the means of 3–4 independent experiments, each performed in triplicate. (F) 30-min kinetic read, and (G) dose-response curve, of β-arrestin recruitment to CCR2 in HEK293 cells in response to 200 nM CCL2 +/− pre-treatment with the indicated concentrations of losartan or EXP3174. Cells were transfected with a NanoBiT CCR2-ARRB1 luciferase construct to monitor CCL2-induced CCR2-β-arrestin interaction over time using the kinetics measurement function of a luminometer. Data representative of the mean of 3 independent experiments each performed in triplicate. (H) Quantitative bar graph of end-point luminescence values of the CCR2-β-arrestin recruitment kinetic curve shown in (F). Data represents one of three independent experiments each performed in triplicate. Error bars, SEM (D) or SD (E, F, G, H).

