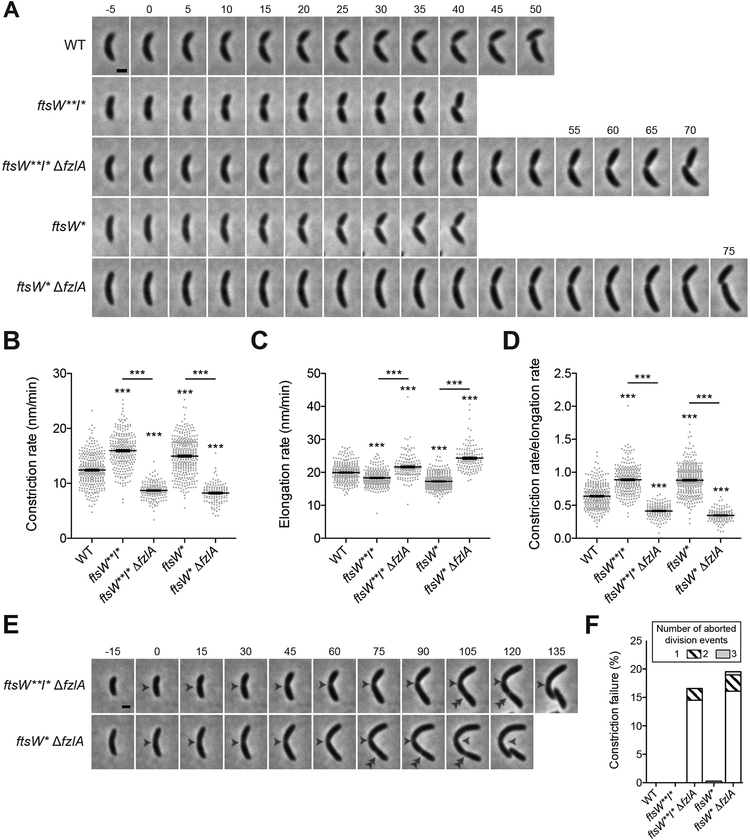
Figure 2. FzlA contributes to efficient division in a hyperactive PG synthase background.
(A) Time-lapse micrographs of constriction in WT or PG synthase hyperactive mutant cells +/− fzlA. Constriction starts at t=0 and concludes in the last frame upon cell separation. Time relative to constriction initiation (minutes) is indicated. Scale bar: 1 μm. (B, C, D) Plots of constriction rate (B), total elongation rate (C), and ratio of constriction rate to total elongation rate (D) for a population of synchronized cells from each indicated strain, calculated from single cell microscopy data. Mean ± SEM shown. Kruskal-Wallis tests with Dunn’s post-test were performed to compare WT and the indicated strains: ***P≤0.001. From left to right, n = 324, 280, 161, 366, 139 (B) and 321, 280, 161, 363,139 (C, D).
(E) Micrographs of constriction failure at the initial division site (single white arrowhead), then initiation and completion at a second site (double white arrowhead) in ΔfzlA cells. As in (A), constriction initiates at t=0 and concludes in the last frame. Scale bar: 1 μm.
(F) Plot of the constriction failure rate in cells in which constriction initiated, then failed at one division site and subsequently initiated and finished at another division site. “Number of aborted division events” refers to the number of times a cell abandoned division at distinct sites within the cell. The y-axis indicates the percentage of cells out of the whole population that aborted division at least once. From left to right, n = 324, 280, 193, 368, 174.
Strain key (Caulobacter): WT (EG865), ftsW**I* (EG1557), ftsW**I* ΔfzlA (EG2170), ftsW*(EG1556), ftsW*ΔfzlA (EG2166). See also Videos S1–S2.

