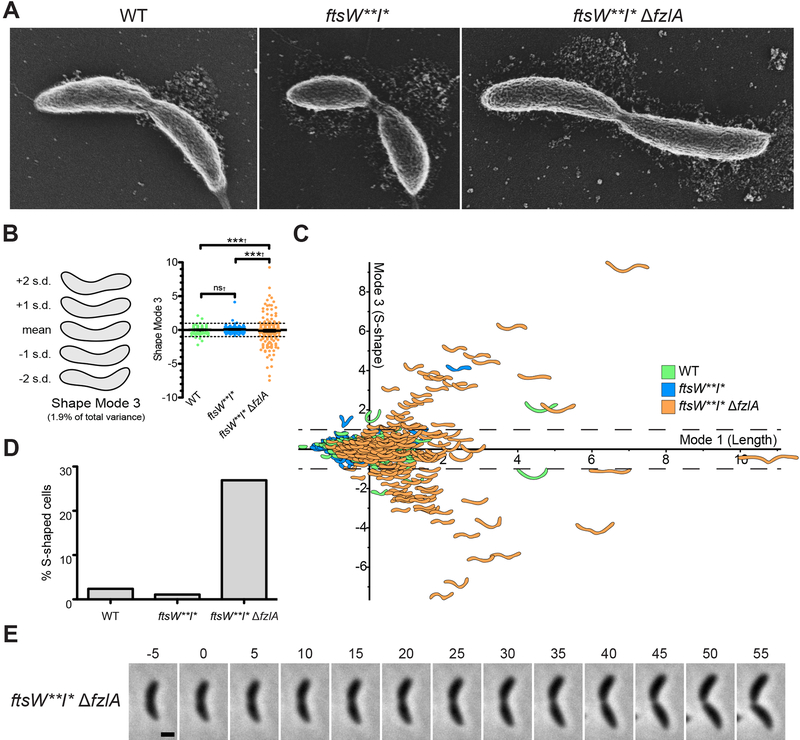
Figure 3. fzlA is required for global shape maintenance.
(A) SEM images of cells from the indicated strains. Scale bar: 200 nm.
(B) PCA of cell shape in a population of cells that have initiated constriction from the indicated strains. Shape mode 3 approximately captures degree of S-shape in cells. Mean cell contour ± 1 or 2 standard deviations (s.d.) is shown (left). Shape mode values for cells in each strain are plotted and mean ± SEM is shown (right). The dashed line drawn at s.d.=1 indicates the cutoff for S-shaped cells (cells with an |s.d.| ≥ 1 are considered to be S-shaped). A Brown-Forsythe Levene-type test (used in populations not assumed to be normally distributed) was performed using R to compare population variances (†): nsP>0.05, ***P≤0.001. From left to right, n = 292, 279, 290.
(C) Plot of shape mode 3 (S-shape) vs. shape mode 1 (length) values for a population of cells that have initiated constriction from the indicated strains. The dashed lines drawn at |s.d.|=1 indicates the cutoff for S-shaped cells.
(D) Plot of percentage of S-shaped cells present in a population of cells that have initiated constriction from the indicated strains. Cells from (B) with an |s.d.| ≥ 1 are considered S-shaped.
(E) Micrographs of cell twisting during division in an ftsW**I*ΔfzlA cell. Constriction starts at t=0 minutes and concludes in the last frame upon cell separation. Scale bar: 1 μm.
Strain key (Caulobacter): WT (EG865), ftsW**I* (EG1557), ftsW**I* ΔfzlA (EG2170). See also Figures S4–S5 and Video S3.

