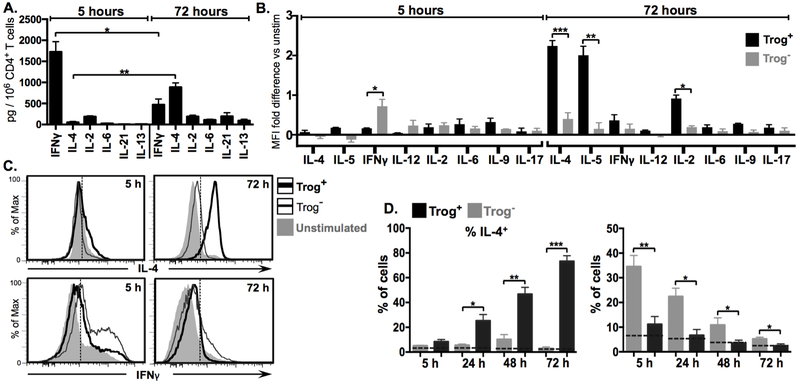
Figure 2. After APC removal, trog+ cells increase expression of TH2-associated effector cytokines, while trog− cells express decreasing levels of TH1-associated cytokines.
Expression of cytokines in CD4+ T cells recovered from a standard in vitro trogocytosis assay was assessed at indicated time points by flow cytometry. (A) Mean levels of subset-characteristic T-helper cytokines in culture supernatant of total recovered T cells at 5 hours (grey) and 72 hours (black) post trogocytosis-assay. (B) Mean fold-difference in the expression of subset characteristic T-helper cytokines between trog+ (black) and trog− (grey) cells, compared to unstimulated CD4+ T cells, at 5 and 72 hours post-recovery, as measured by intracellular cytokine staining (ICS) MFI. (C) Representative histogram plots of ICS data showing fluorescence intensity of IL-4 (top) and IFNγ (bottom) in trog+ (thick black line) and trog− (thin black line) CD4+ T cells. Unstimulated controls are shown in shaded grey for comparison. Dashed vertical line represents the maximum MFI for >99% relevant isotype control. (D) Frequency of IL-4+(left) or IFNγ+(right) CD4+, trog+ (black), and trog− cells over 72 hours after APC removal. Dashed horizontal line represents mean percentage of unstimulated CD4+ T cells for respective cytokines. In Figs. A, C and F, error bars represent ±SEM from three independent experiments, where * = p≤ 0.05, ** = p≤ 0.01, and *** = p≤ 0.001. In Figs B and D, dotted vertical lines represent the fluorescence intensity >99% of recovered CD4+ cells stained with respective isotype controls. All ICS data is representative of at least three independent experiments.

