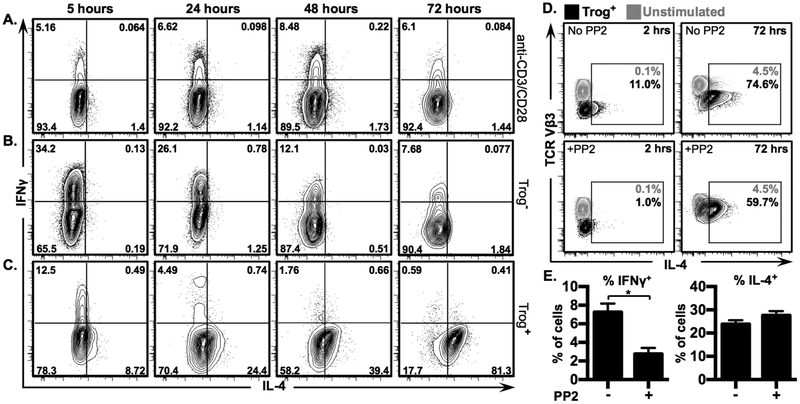
Figure 4. Trogocytosis-mediated signaling drives IL-4, but not IFNγ, expression in trog+ cells.
Non-polarized CD4+ T cells were used in a standard in vitro trogocytosis assay, or were stimulated with plate-bound anti-CD3 + anti-CD28. Levels of IL-4 and IFNγ were measured by ICS and analyzed via flow cytometry. Representative 2D flow plots show fluorescence intensity of IL-4 vs IFNγ in (A) Ab-stimulated blasts, (B) trog− cells, and (C) trog+ cells, at indicted time points post-recovery. Gates were established using respective isotype-control staining where >99% of CD4+ cells stained with isotype controls fell in the lower left quadrant. Numbers in corners represent frequency of cells in respective quadrants. Data are representative of at least 3 independent experiments. (D) Immediately after recovery from an in vitro trogocytosis assay, cells were left untreated (top row) or were treated for 20 minutes with 20 μM PP2 (bottom row) to halt TCR signaling. PP2 was removed from cultures and cells were analyzed at 2 (left column), and 72 hours (right column), after PP2 removal. Trog+ cells are shown in black, compared to unstimulated cells in grey. Numbers represent frequency of cells included in respective gates. (E) Mean frequency of IFNγ+ and IL-4+ trog+ cells, 24 hours after PP2 removal, compared to untreated trog+ cells. Error bars represent ±SEM from three independent experiments, * = p≤ 0.05. All data is representative of at least three independent experiments.

