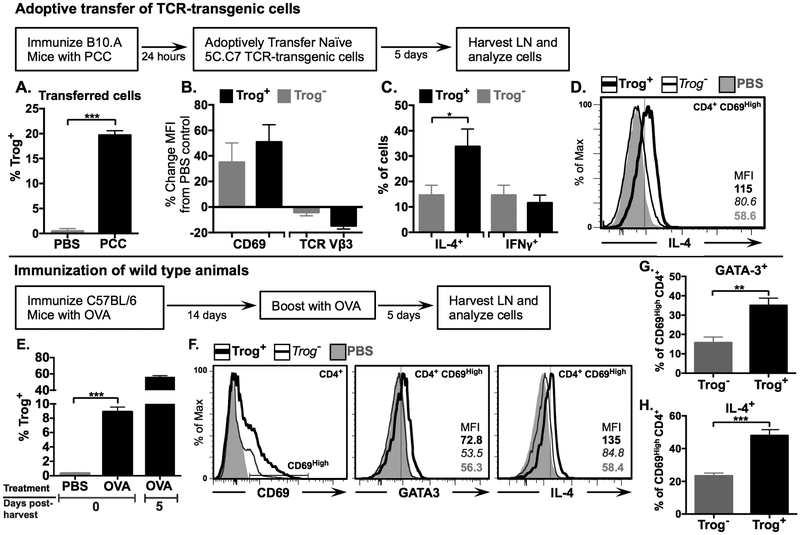
Figure 8. In vivo, trog+ CD4+ T cells display a TH2 phenotype.
(A-D) Adoptive transfer. B10.A mice (n=3) were immunized s.c. with 300 μg of PCC protein, or PBS as a control. Twenty-four hours after immunization, 2 × 10⁶ naïve CFSE-labeled 5C.C7 T cells were adoptively transferred into immunized B10.A recipients. Cells were harvested and analyzed via flow cytometry 5 days following adoptive transfer. (A) Mean frequency of trog+ cells from recovered adoptively transferred cells in PBS injected (grey) and PCC immunized (black), mice. (B) Mean percent change in CD69 (left) and TCR Vβ3 (right) expression in trog+ (black) and trog− (grey) recovered, adoptively transferred CD4+ cells, compared to recovered, adoptively transferred CD4+ cells, from PBS control animals as determined by in MFI. (B) Frequency of IL-4+ (left) and IFNγ + (right) trog+ (black) and trog− (grey) CD4+ CD69High adoptively transferred cells recovered from PCC immunized animals (D) Representative histogram of intracellular IL-4 expression of trog+ (thick black line) and trog− (thin black line) CD4+ CD69High adoptively transferred cells recovered from PCC immunized animals, compared to adoptively transferred CD4+ T cells recovered from PBS control animals (shaded grey). In Figs. A-C, Error bars represent ±SEM from three biological replicates, * = p≤ 0.05 and *** = p≤ 0.001.
(E-H) Wild type immunization C57BL/6 mice (n=3) were immunized s.c. with 300 μg of OVA protein or PBS as a control and boosted with OVA 14 days later. Draining lymph nodes were collected five days following booster immunization (day 19) and analyzed immediately. An aliquot of recovered cells was cultured post-recovery and analyzed on day five. (E) Mean frequency of trog+ CD4+ T cells from PBS injected (left) and OVA-immunized (center) mice immediately following recovery. (Right) The frequency of trog+ CD4+ T cells from OVA-immunized mice after a day five culture in vitro. (F) Representative histogram overlays showing levels of CD69 in CD4+ T cells (left) and the expression of GATA-3 (middle) and IL-4 (right) in trog+ (thick black line) and trog− (thin black line) CD69High CD4+ T cells. CD4+ T cells from PBS control mice are shown in shaded grey. (G-H) Frequency of (G) GATA-3 and (H) IL-4+, trog+ (black) and trog− (grey) CD69High CD4+ T cells recovered from OVA immunized mice. For histograms, dotted vertical lines represent the maximum fluorescence intensity of 99% of CD4+ cells stained with respective isotype controls. In Figs. E, G and H, error bars represent ±SEM from three biological replicates, * = p≤ 0.05, ** = p≤ 0.01 and *** = p≤ 0.001. Data is representative of at least two separate experiments.

