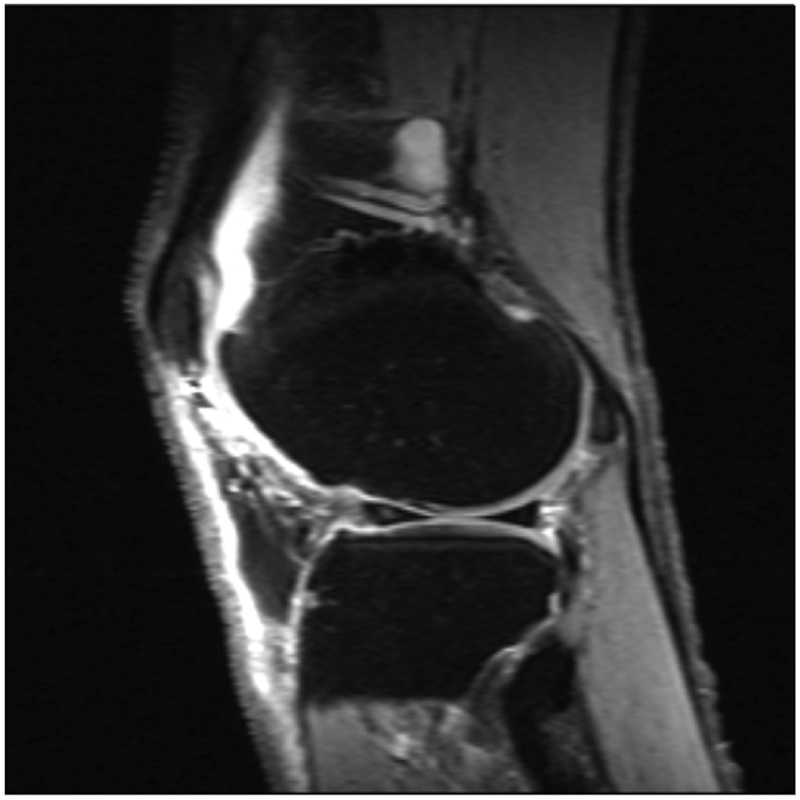
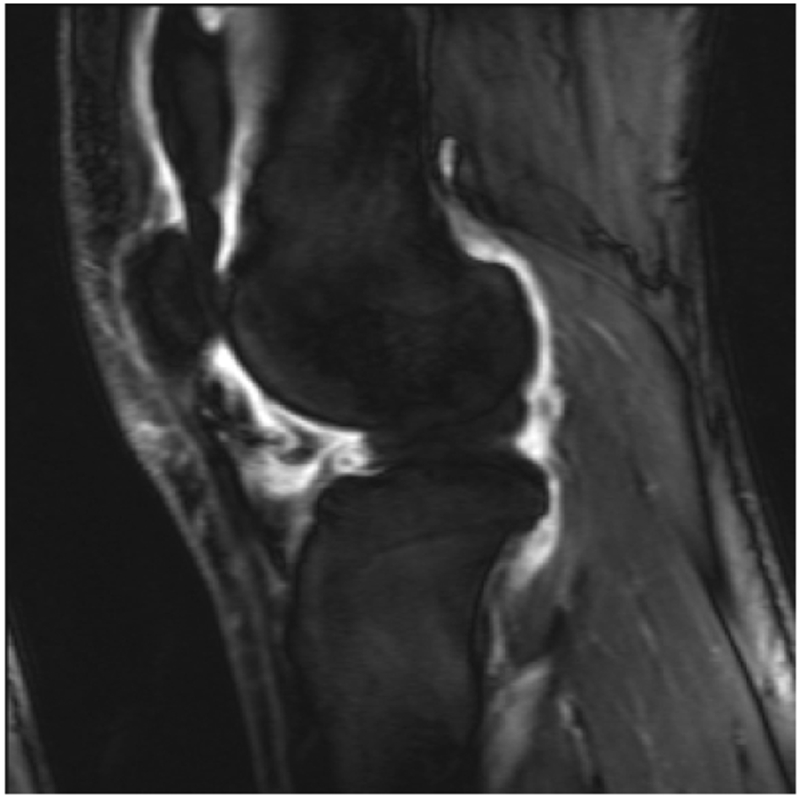
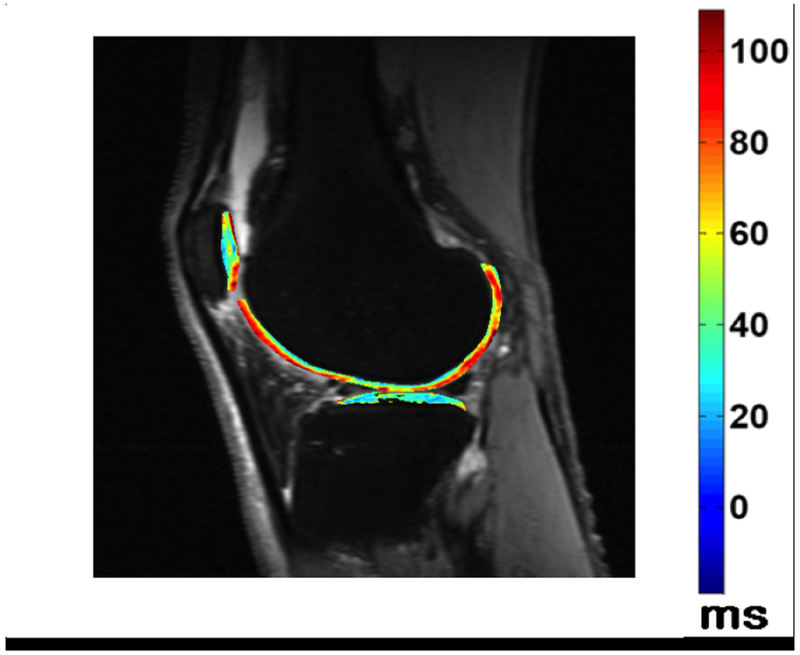
Figure 4 –


Fluid sensitive images in a patient with knee pain, demonstrating intraarticular increased signal intensity (a), which corresponds to increased synovial volume on contrast enhanced images (b). T1rho imaging with a color map of the cartilage in the lateral tibiofemoral compartment denoting areas of cartilage degradation.
