Figure 6.
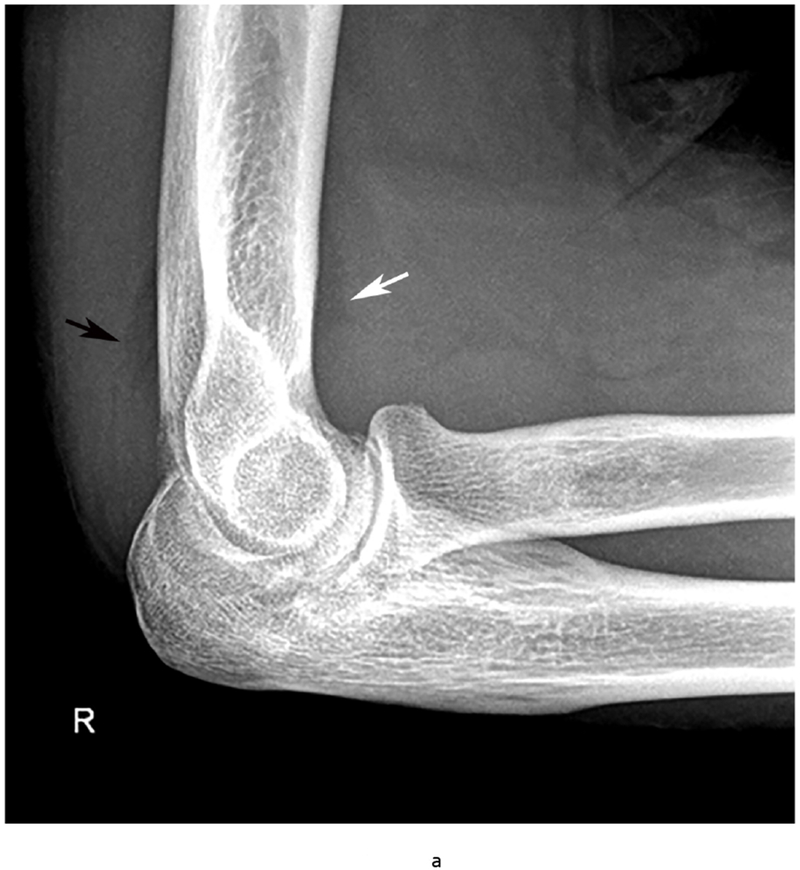
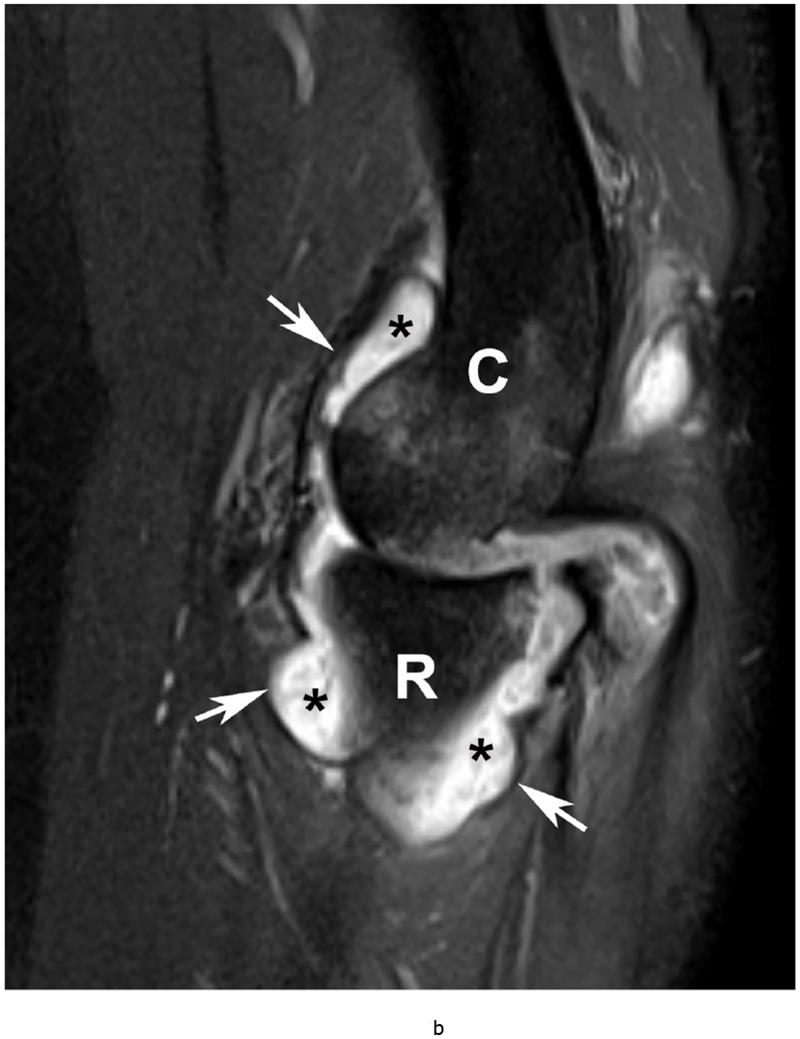
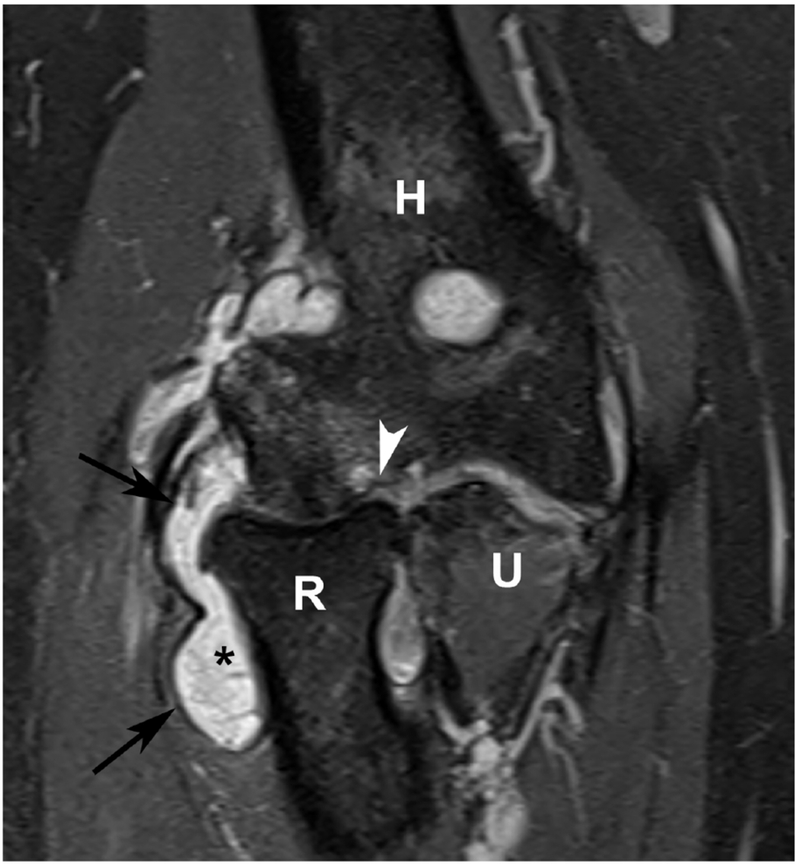
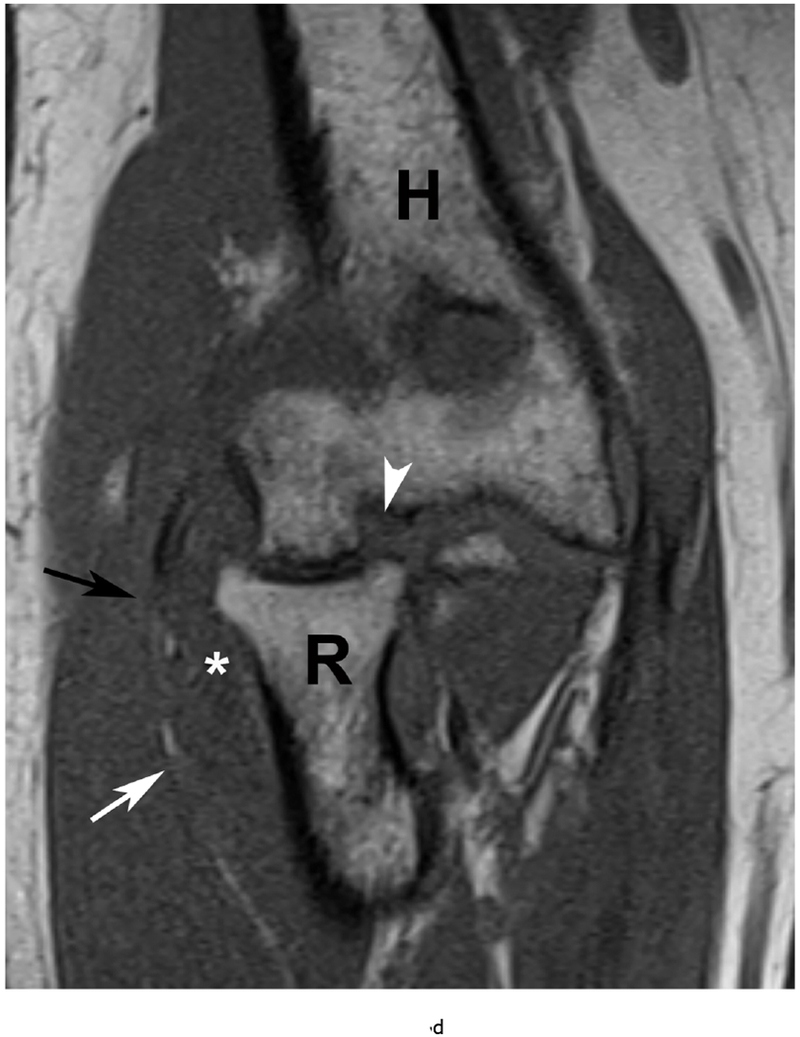
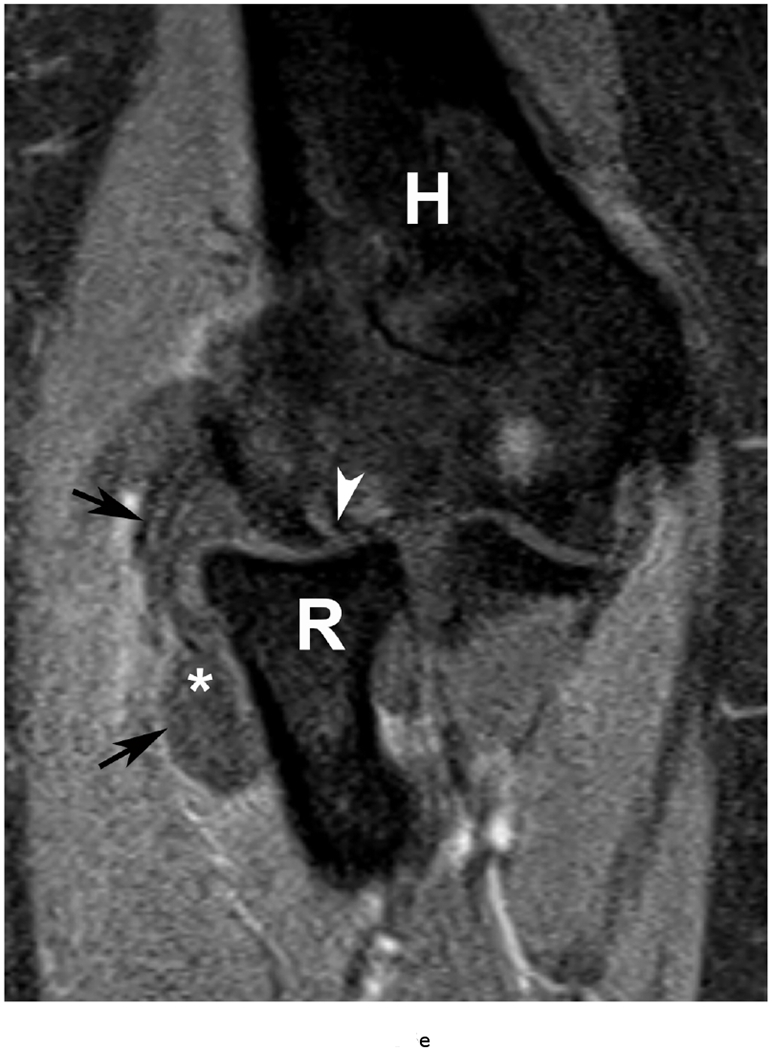
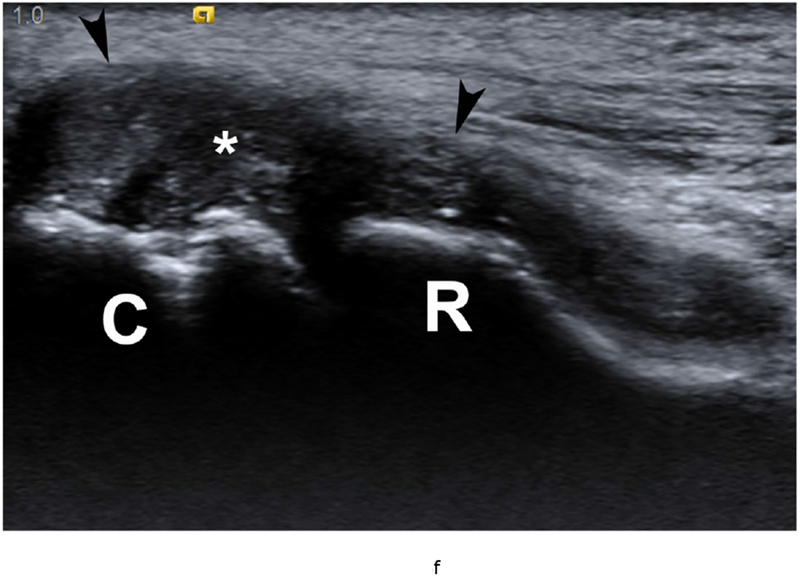
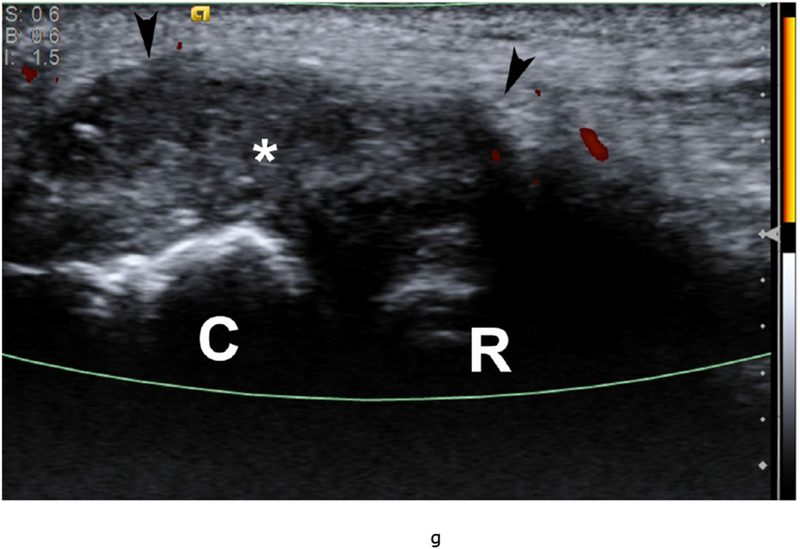
37 year old female with RA. (a) Lateral elbow radiograph demonstrating elevation of the anterior (white arrow) and posterior (black arrow) fat pads, considered a plain radiographic sign of an effusion however cannot differentiate between synovitis and effusion. (b) Sagittal T2 FS (TR 4400 / TE 50), coronal (c) T2 FS (TR 4210 / TE 33), (d) T1 (TR 645 / TE 8.9) and (e) T1 FS post contrast (TE 846 / TE 8.9) images demonstrating high T2 signal non-enhancing synovitis and pannus formation (*) diffusely expanding the joint capsule (black arrows). A small osseous erosion is seen involving the capitellum (white arrowheads) with subjacent bone marrow edema. Gray scale (f) and Power Doppler (g) ultrasound images in the same patient demonstrating non vascularized hypertrophied synovium (*) distending the joint capsule (black arrowheads) compatible with the absence of enhancement on MRI. C – Capitellum; R – Radial Head; H - Humerus.
