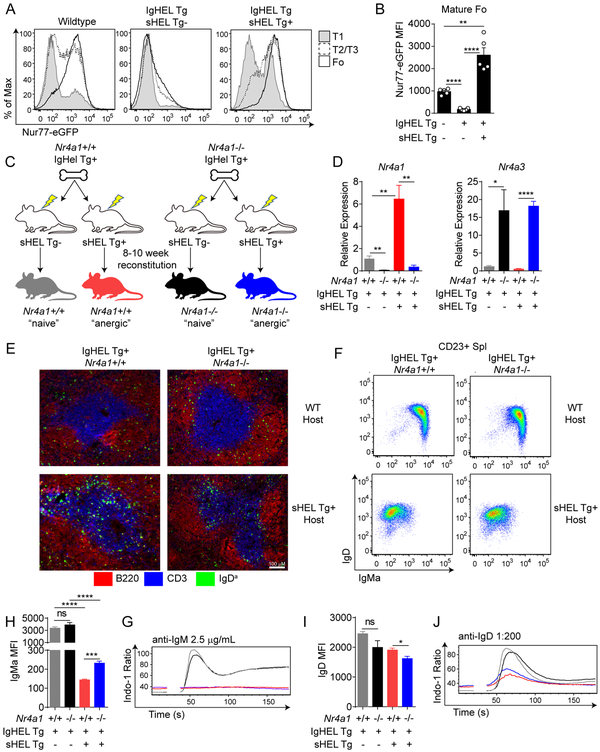
Figure 1. Nur77 is upregulated, but dispensable for anergy, in IgHEL B cells chronically exposed to soluble cognate antigen.
A. B220+ splenic B cells from WT, IgHEL Tg, and IgHEL/sHEL Tg Nur77-eGFP mice were stained with CD23 and CD93 to identify T1(CD23− CD93+), T2/3 (CD23+ CD93+) and Follicular (CD23+ CD93−) subsets. Histograms represent Nur77-eGFP expression in these cells and are representative of at least 5 independent experiments. B. Quantification of Nur77-eGFP MFI as shown in Fig 1A. C. Schematic representation of IgHEL/sHEL Tg chimera generation. Lethally irradiated wildtype or sHEL Tg hosts were reconstituted with 5×10⁶ bone marrow cells from either Nr4a1+/+ or Nr4a1−/− IgHEL Tg hosts. After at least 10 weeks of reconstitution, mice were sacrificed for further analysis. D. Mature CD23+ splenic B cells were sorted from IgHEL chimeras. Relative Nr4a1 and Nr4a3 mRNA expression was determined via qPCR. N=4 for each group. E. Representative spleen sections depicting localization of adoptive transferred Nr4a1+/+ or Nr4a1−/− IgHEL Tg B cells (IgDa+) into WT or sHEL Tg hosts after 12 hours. Data are representative of two independent mice of each of four conditions. F. Representative flow plots showing IgM and IgD expression on splenic CD23+ mature B cells from chimeras. G, I. Quantification of IgMa and IgD MFI as shown in Fig 1F. H, J. Splenic B cells from IgHEL/sHEL Tg chimeras were loaded with Indo-1 dye. Ratiometric assessment of intracellular calcium was assessed by flow cytometry after stimulation with anti-IgM (2.5 μg/mL, H) or anti-IgD (1:200 dilution, J). Plots are representative of 3 (D) or 4 (G, I) separate mice per group.

