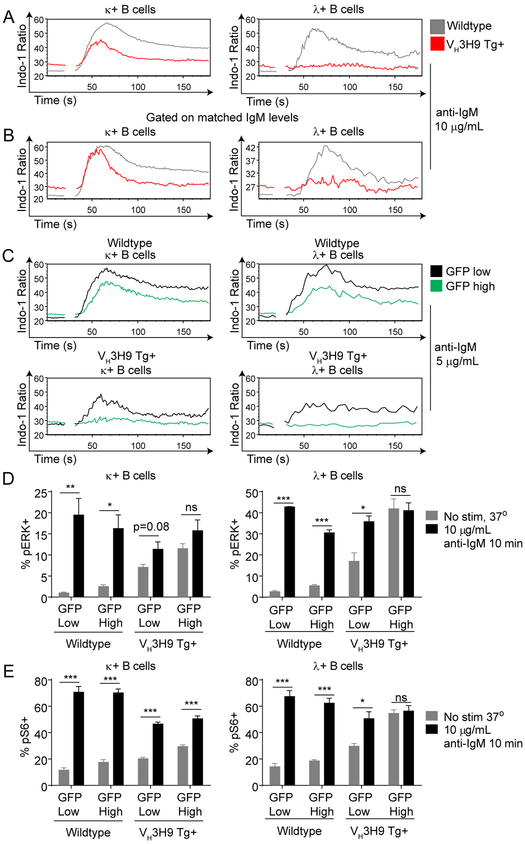
Figure 6. Nur77-eGFP expression correlates with B cell anergy in VH3H9 Tg mice.
Splenic B cells from WT and VH3H9 Tg Nur77-eGFP mice were loaded with Indo-1 dye. Ratiometric assessment of intracellular calcium was determined by flow cytometry. Samples were run for 30 seconds to assess basal calcium flux, and then anti-IgM was added to stimulate the cells. A. Spleens were harvested from WT or VH3H9 transgenic Nur77-eGFP mice, and intracellular calcium entry was assessed after stimulation with 10 μg/mL anti-IgM. Data is representative of at least 3 independent experiments. B. Intracellular calcium entry was assessed as in Fig 6A. A narrow IgM gate was drawn to assess intracellular calcium entry on cells with matched IgM levels. Data is representative of at least 3 independent experiments. C. Splenic B cells from WT or VH3H9 transgenic Nur77-eGFP mice were harvested, and intracellular calcium entry was assessed after stimulation with 5 μg/mL anti-IgM. The top and bottom 10% Nur77-eGFP expressing cells were gated as GFP-high and GFP low respectively. Data is representative of at least 3 independent experiments. D. Spleens from Nur77-eGFP VH3H9 Tg+ and Tg- mice were stimulated at 37° with 10 μg/mL IgM for 10 minutes. Phosphorylated ERK expression was determined via intracellular flow cytometry staining. N=5 for each group. E. Spleens from Nur77-eGFP VH3H9 Tg+ and Tg- mice were stimulated at 37° with 10 μg/mL anti-IgM for 45 minutes. Phosphorylated S6 expression was determined via intracellular flow cytometry staining. N=5 for each group

