
Figure 5. The relationship between plasma renin, aldosterone and plasma uric acid (PUA) in combined cohorts with type 1 diabetes (T1D, panels A,B), adolescents (panels C,D), young adults (panels E,F), older adults with T1D (panels G,H).
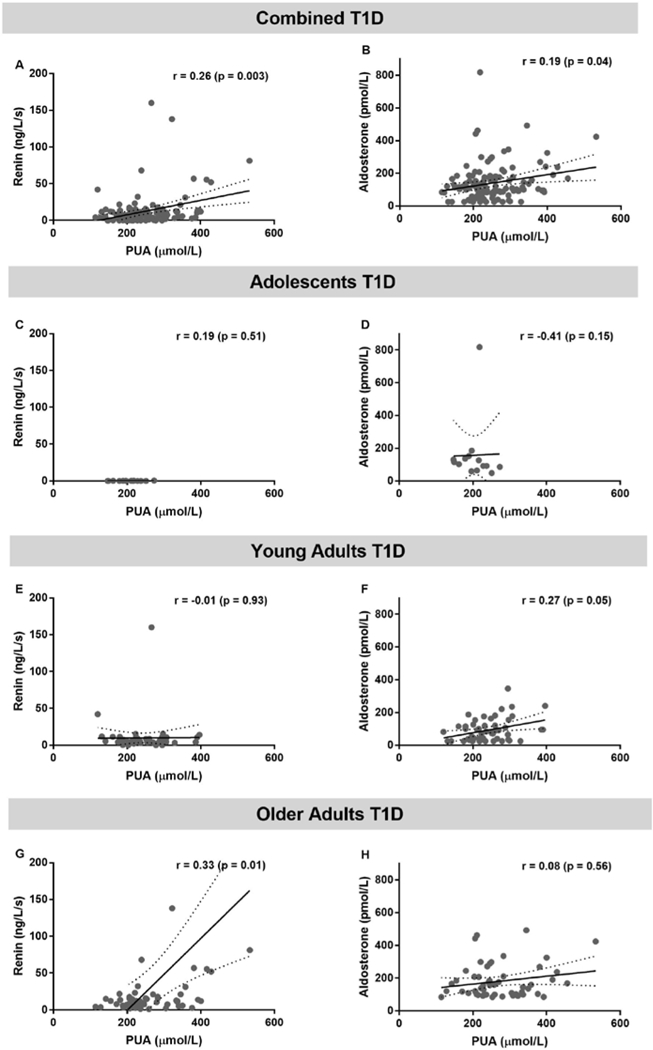
SPEARMAN correlation analysis was used to obtain r and its associated p value. Linear regression models are presented as mean (solid line) and 95% confidence interval of the mean (dashed lines).